
SEARCH FOR YIELDS Issue 4, October 31st
What bonds do I recommend to clients?
I am asked one question most frequently by bond advisors in all my interactions with them, which is "What bonds do I recommend to clients?". Normally I base my answers on the current state of bond markets and the future outlook for interest rates and credit spreads. Now, looking back, this kind of answer would resonate well with a bond trader or bond fund manager and may not be really understood by clients of bond advisors.
I have now made the answer to the question "What bonds do I recommend for my clients?" very simple, its just one graph - and this graph is available real time on INRbonds Marketwatch.
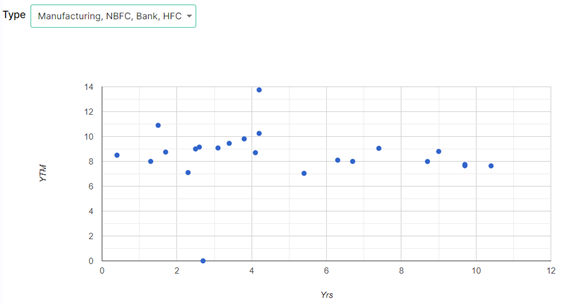
This graph shown here, maps bond yields to bond maturity. Bond yields, which is the return you will receive from a bond investment, range from 4% to over 10% at present. Bond maturity, which is the time period you will have to hold the bond to get your capital back, ranges from 1 year to 10 years and above, sometimes to even perpetuaty in case of perpetual bonds.
Bond advisors just need to map the return requirement of their clients to their holding period and then select bonds accordingly from the graph. They can build ladder portfolios based on future cash flow requirements or any other kind of portfolio from just one simple graph.
This is too easy, but what about the risk?
Don't worry, risk is very much part of this graph. There are two main risks - interest rate risk, which is the risk of bond price and bond value falling when interest rates rise and credit risk, which is the risk of not getting your capital back on maturity. This graph will tell you that the higher the yield or returns you seek the higher the interest rates risk or credit risk or both. All you need to do is match the risk profile of your clients with the bonds to invest in to equate the return with the risk of the bond.
Bond advisors can make it simple for themselves and their clients with INRBonds one simple graph, available real time on INRbonds Marketwatch.