
Weekly Market Highlights:
The RBI’s record dividend transfer of Rs 2.69 trillion for FY25 has significantly brightened the domestic fiscal landscape, enhancing government spending capacity and boosting market liquidity. Unlike last year, when pre-election disbursements frontloaded spending by June, this year’s larger transfer could support sustained expenditure well beyond mid-year. Coupled with strong liquidity measures and rising hopes of a rate cut in the upcoming June policy, Indian G-Secs appear poised for further upside.
On the global front, however, UST yields—especially the 30-year—have climbed past 5.1%, reflecting rising fiscal concerns as the U.S. national debt hits a record $36 trillion. A widening fiscal deficit of $1.9 trillion continues to exert upward pressure on yields. Additionally, this week’s 40-year JGB auction is critical—any significant jump in Japanese yields (currently at 3.07%) could prompt capital shifts from UST to Japanese bonds, pushing UST yields even higher.
In this tug-of-war between supportive domestic signals and external pressures, bond market direction will hinge on how global yield movements interact with India’s robust fiscal backdrop
Last Week Highlights
The RBI has approved a record dividend transfer of Rs 2.69 tn to the Centre for FY25. This is based on the revised Economic Capital Framework (ECF), approved by the Central Board on May 15, 2025. The Contingent Risk Buffer (CRB) was raised to 7.5% of RBI’s balance sheet, up from 6.5% in FY24 and 6.0% in FY23. The higher CRB led to provisioning of Rs 449 bn, vs Rs 314 bn at a 6.5% level. Without this increase, the dividend would reach Rs 3.5 tn.
Long-term UST yields, especially the 30Y, have climbed above 5.1%, driven by soaring fiscal debt, now at a record USD 36 tn (up from USD 28 tn in 2020), and a large fiscal deficit of USD 1.9 tn. With a debt-to-GDP ratio of 120%, concerns are rising about the sustainability of US borrowing. Traditionally, foreign investors like China and Japan, with large trade surpluses, helped fund US deficits, but trade tensions and expanding US debt have reduced their participation. At the same time, US households are net dissavers, meaning domestic savings are insufficient to meet borrowing needs. This raises fears the Fed may have to step in, increasing inflation risks and pushing long-term yields even higher. Elevated yields raise borrowing costs, notably for mortgages, which could dampen real estate activity and slow the US economy—potentially triggering a global downturn affecting major exporters.
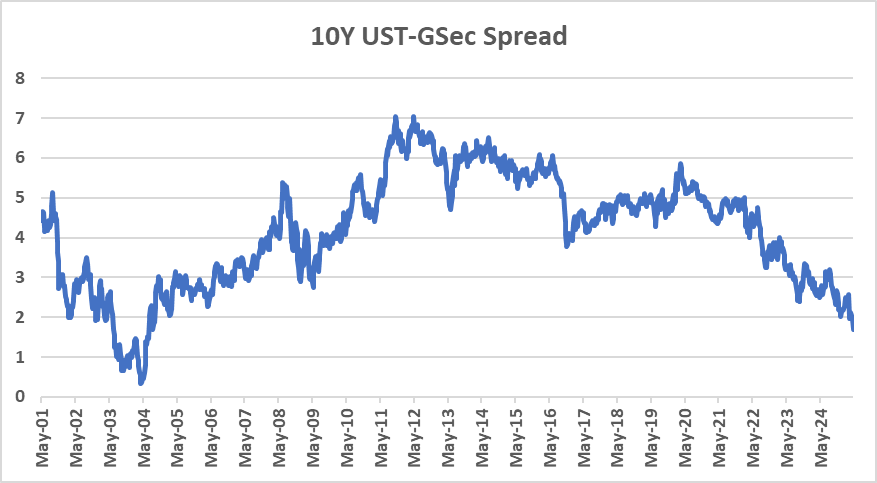
In India, 10Y G-Sec yields have fallen from over 7% to 6.2% over the past year, driven by 2 25 bps rate cuts by the RBI, with more cuts expected. The RBI’s dovish stance is due to contained inflation, signs of domestic consumption weakness (visible in corporate earnings), and concerns about export headwinds from a slowing global economy. The RBI has also purchased over Rs 5 tn in government bonds this year, reducing supply and supporting yields. With the India-US bond yield spread narrowing, there are concerns about capital outflows toward higher-yielding US Treasuries. However, fiscal and inflation risks in the US may temper that shift. The RBI believes that higher US yields may lead to a slowdown, affecting India. In response, it is expected to maintain an accommodative policy stance—cutting rates, boosting liquidity, and shoring up reserves to support consumption amid rising global uncertainty.
Market Data | |||
Particulars | 16/5/2025 | 9/5/2025 | Change |
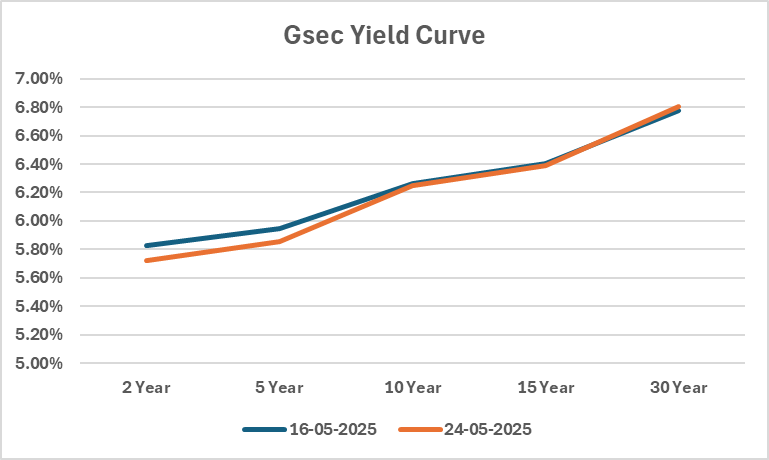
10 Yr Benchmark Gsec (%) | 6.26% | 6.41% | -14 bps |
Banking Liquidity (in Rs Billion) | 2229 | 1325 | 68.23% |
5 Yr OIS (%) | 5.65% | 5.66% | -1 bps |
1 Yr OIS (%) | 5.62% | 5.63% | -1 bps |
INRBonds Retail High Yield Index | 9.68% | 9.69% | -1 bps |
Nifty | 25,020 | 24,008 | 4.22% |
10 Yr SDL | 6.71% | 6.71% | 0 bps |
91 Day T-Bill (%) | 5.84% | 5.88% | -4 bps |
182 Day T-Bill (%) | 5.84% | 5.88% | -4 bps |
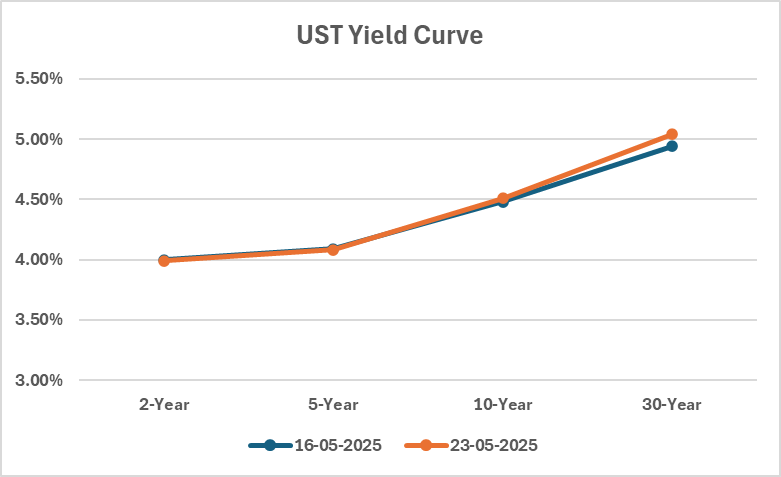
10 Yr US Treasury Yield (%) | 4.48% | 4.38% | 10 bps |
US Junk Bond Yield (%) | 7.28% | 7.54% | -26 bps |
Brent Crude Oil (In USD per Barrel) | 65.39 | 63.92 | 2.30% |
Primary & Secondary Corporate Bonds Data | |||
Top 5 Secondary Retail Trades | Maturity | Yield | - |
9.62% Nuvama Wealth Finance Limited | 16/6/2027 | 9.65% | |
9.30% IIFL Finance Limited | 21/4/2027 | 10.35% | |
9.75% Veritas Finance Limited | 25/6/2027 | 9.46% | |
10.25% Sammaan Capital Limited | 28/6/2027 | 10.55% | |
9.65% Adani Enterprises Limited | 12/9/2027 | 10.10% | |
Currency Market Data | |||
Particulars | 16/5/2025 | 9/5/2025 | Change |
USD/INR | 85.57 | 85.409 | 0.19% |
DXY | 100.7 | 100.34 | 0.36% |
USD/ Brazil Real | 5.66 | 5.67 | -0.18% |
EUR/ USD | 1.12 | 1.1248 | -0.43% |
USD/CNY | 7.21 | 7.237 | -0.37% |
USD/JPY | 145.49 | 145.36 | 0.09% |
USD/ Russian Ruble | 80.75 | 82.5 | -2.12% |