
Domestic stock indices declined heavily amid global equity sell-off on weekly basis driven by hawkish stance of US Fed and geo-political crisis between Russia and Ukraine. Cipla, Dr Reddy, Kotak Mahindra Bank, L & T reported Q3 earnings during the week. Cipla registered a 2.61% year-on-year decline in in net profit(consolidated) during Q3FY22. Net profit of L&T came down by 16.7% on yearly basis during Q3FY22.
Domestic equity market is expected to remain volatile due to upcoming Union Budget FY2022-23 and global factors. This week BPCL, Dabur, ITC, JK Lakshmi, M & M Fin, Lupin, Titan will report Q3 earnings.
FIIs/FPIs have sold Rs. 190 billion in December 2021 and sold Rs. 282 billion in January 2022.
Wallstreet indices rose last week after decline in previous week. US growth rate for Q4FY21 and fall in initial jobless claim have driven the market surge. US GDP expanded by 6.9% during Q4FY21. During the week, Dow Jones rose by 1.34%, S&P 500 gained 0.75% while NASDAQ remained steady.
European indices declined on Friday. Factors like policy rate hikes by central banks and geo-political issues between Russia and Ukraine continued to impact adversely on the market. During the week, DAX declined by 1.76 % and FTSE lost 0.63%.
Crude oil prices gained for 6th consecutive week amid supply disruption concerns amid prolonged tensions in Eastern Europe and the Middle East. As per US EIA sources, U.S. crude oil inventories declined as of 21st Jan on weekly basis while gasoline inventories rose during that period.
Global Economy
US economy expanded an annualized 6.9% on quarter in Q4 202 as compared 2.3% in Q3 and above forecasts of 5.5%. Personal consumption increased 3.3%, pushed higher by a 4.7% surge in services spending, namely health care, recreation, and transportation. Fixed investment rebounded by 1.3%.
US initial number of unemployment benefits fell by 30 thousand from the previous period to 260 thousand in the week ending January 22.
The personal consumption expenditure price index in the United States rose by 5.8% from one year ago in December 2021, the largest annual increase since July 1982, reflecting sharp gains in costs for both goods (8.8% vs 8.5%) and services (4.2% vs 4.3%).
The consumer confidence indicator in the Euro Area was confirmed at -8.5 in January of 2022, the lowest level since March of last year, reflecting lower expectations about households’ financial situation and both the present and future general economic situation.
Equity Indices | 28-01-2022 | 21-01-2022 | % Change week on week |
Indian Indices | - | - | - |
Nifty | 17102 | 17617 | -2.92% |
Sensex | 57200 | 59037 | -3.11% |
CNX Midcap | 29805 | 30563 | -2.48% |
Bank Nifty | 37689 | 37574 | 0.31% |
CNX Infra | 4978 | 5100 | -2.39% |
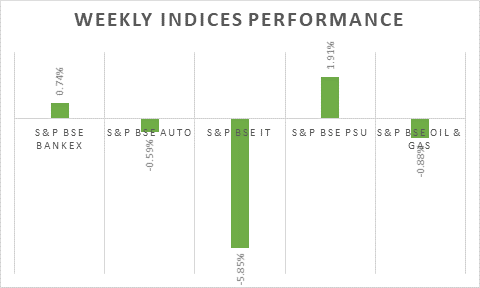
CNX IT | 33852 | 36054 | -6.11% |
Derivatives Nifty Near month | 17367 | 17647 | -1.59% |
Spread over underlying | 265 | 30 | 783.33% |
Implied Volatility Put | 17.32% | 15.10% | 14.70% |
Implied Volatility Call | 25.33% | 16.09% | 57.43% |
Global Market indices | - | - | - |
Nikkei 225 | 26717 | 27522 | -2.92% |
Hong Kong Hangseng | 23550 | 24965 | -5.67% |
China Shanghai Composite | 3361 | 3522 | -4.57% |
Korea Kospi | 2663 | 2834 | -6.03% |
German DAX | 15319 | 15603 | -1.82% |
UK FTSE | 7466 | 7494 | -0.37% |
Dow Jones Industrial | 34725 | 34265 | 1.34% |
Nasdaq | 13770 | 13769 | 0.01% |
Currency Market | - | - | - |
USD/INR Rs | 75 | 74.42 | 0.78% |
EUR/USD USD | 1.11 | 1.13 | -1.77% |
USD/JPY JPY | 115.26 | 113.67 | 1.40% |
USD Index DXY | 97.21 | 95.62 | 1.66% |
Commodities Market | - | - | - |
Brent Crude Oil (USD/Barrel) | 90.03 | 87.74 | 2.61% |
Gold (USD/ Oz) | 1785 | 1836 | -2.78% |