The government issued a new ten year benchmark bond last week, the 7.26% 2029 bond. The cut off at 7.26% was 24bps lower than the yield on the old 10 year benchmark bond, the 7.17% 2028 bond. The cut off yield was bullish given that bond yields had risen 25bps from lows over the last few weeks.
Given the bullish cut off, where will yields on the 7.26% 2029 bonds go over the short to medium term?
In the short term, markets will play for RBI turning neutral on policy or even rate cuts, given weak economic data. IIP growth for November 2018 fell to 0.5% from 8.5% last year while manufacturing growth was negative -0.4% against 10.4% last year. The festive season in November 2018 as against October in 2017 contributed to the fall in IIP but other factors such as slowdown in vehicle sales and credit freeze for NBFCs also affected demand and production.
CPI inflation will stay below 3% in December 2018 given drop in food prices and fall in global crude oil prices, that had fallen 25% from highs seen in 2018.
Globally, there is economic weakness as highlighted by RBI in its December policy review and the fact that global growth estimates are being slashed by various agencies. Fed may scale back rate hikes in 2019 while ECB could signal a longer record low interest rate policy.
RBI is buying bonds through OMOs and this is taking out supply from the market.
Given all this, markets could take down yields on the 7.26% 2029 bond in the near term.
In the medium term, next fiscal year borrowing would increase supply and RBI is not likely to be a heavy buyer of bonds if liquidity stabilizes in the system. Food inflation too may pick up given the sharp plunge in food prices. Elections too could cause uncertainty on fiscal policy.
Globally, economic uncertainty could add to volatility in markets, causing pain for the INR.
Bond markets would turn cautious post budget and RBI policy in February 2019 and yields on the 7.26% 2029 bond would tend to rise from lows.
The 10-year benchmark government bond, the 7.17% 2028 bond, saw yields close 5 bps up at 7.50% on weekly basis. The benchmark 5-year bond, the 7.37% 2023 bond saw yields close 1 bps up at 7.26% and the 6.68% 2031 bond yield remain unchanged at 7.62%. The long bond, the 7.06% 2046 bond yields close 2 bps down at 7.63% on weekly basis.
OIS market saw one year yield close down by 3 bps and five year OIS yield remain unchanged last week. One year OIS yield closed at 6.54% while five year OIS yield closed at 6.66%.
System liquidity as measured by bids for Repo, Reverse Repo, Term Repo and Term Reverse Repo in the LAF (Liquidity Adjustment Facility) auctions of the RBI and drawdown from Standing Facility (MSF or Marginal Standing Facility) and MSS/CMB bond issuance was in deficit of Rs 97 billion as of 11th January 2019. Liquidity was in a surplus of Rs 289 billion as of 4th January 2019. Liquidity will stay in deficit on advance tax outflows this month.
In the last one month FIIs exposure to corporate bonds rose sharply
FIIs exposure to corporate bonds rose by Rs 91.69 billion from 7th December 2018, as an appreciating INR and high credit spreads offered a good risk return profile. Corporate access to funds have not been cut off despite a credit market freeze and the fact that RBI is infusing liquidity into the system through bond purchases and keep rates steady going forward.
· As on 11th January, FII debt utilisation status stood at 57.75% of total limits, 31 bps lower against the previous week. FII investment position was at Rs 4122 billion in INR debt. FII investment position stands at Rs 2068 billion in gilt securities that also includes investment in Interest Rate Futures and at Rs 2054 billion in corporate bonds.
· For the week ended 11th January, credit spreads were mixed. Three-year AAA corporate bonds were trading at levels of 8.50%, spreads were 14 bps lower at 131 bps against the previous week.
· Five-year AAA corporate bonds were trading at levels of 8.68%. Spreads were 9 bps lower at 126 bps.
· Ten-year AAA corporate bonds were trading at levels of 8.80% with spreads 5 bps higher at 116 bps.
· Three months and twelve months PSU bank CD yields were trading at 6.95% and 7.90% levels at spreads of 35 bps and 103 bps respectively against T-bill yields.
· Three months’ maturity Manufacturing and NBFC sector CPs were trading at 7.15% and 7.45% levels respectively. One-year maturity Manufacturing and NBFC sector CPs were trading at 8.47% and 8.70% levels respectively.
Weekly G-sec Curve Spread Analysis
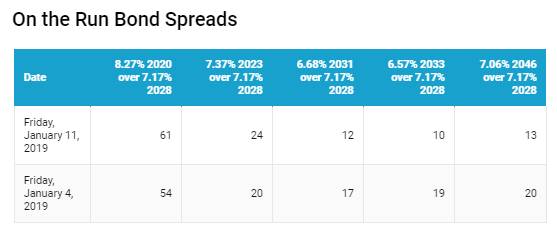
· The yield curve flattened at the long end as 10-year G-sec yields rose by 5 bps while other long end bonds 6.68% 2031 bond yields remained unchanged while 6.57% 2033 & 7.06% 2046 yields fell by 2-4 bps. Given the cut off on the new ten year bond at 7.26%, yield curve steepened in relation to the new benchmark bond.
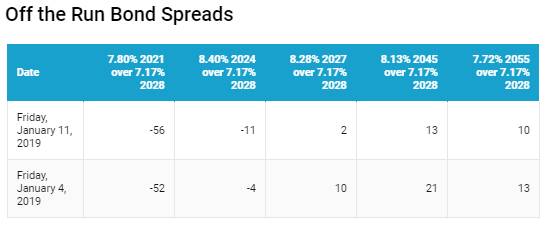
· Off the run bond spreads with the 10-year G-sec were mixed last week.
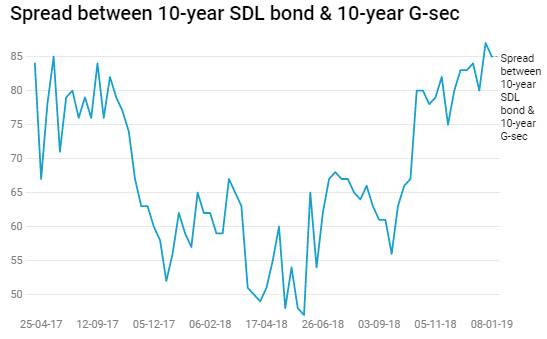
· On the 8th January 2019 auction, Gujarat & Maharashtra has accepted an additional amount of Rs 3 billion & Rs 5 billion respectively and the spread between SDLs with 10-year G-sec came in at 85 bps. On 1st January 2019 auction, the spread between SDLs with 10-year G-sec was at 87 bps.