The bond market is awaiting the government borrowing numbers for fiscal 2019-20, which will be released in the interim budget on the 1st of February. The 10 year benchmark bond, the 7.26% 2029 bond saw yields rising on the back of borrowing worries.
The borrowing for next fiscal will depend on budget estimates for nominal GDP growth, fiscal deficit target as percentage of GDP, redemptions for the year and the amount of financing the deficit through small savings schemes.
Government, in fiscal 2018-19, budgeted for government borrowing financing 66% of the fiscal deficit. In all the earlier years, borrowing financed over 80%, some years over 90% of the fiscal deficit.
Assuming the government sticks to borrowing financing 66% of fiscal deficit, what will be the gross and net borrowings?
Nominal GDP growth assumption of 12% (same as fiscal 2018-19) and fiscal deficit target of 3% as per FRBM estimates, the net borrowing works out to Rs 4.17 trillion (3% of Rs 210 trillion). Nominal GDP is estimated at Rs 188 trillion for fiscal 2018-19 and at 12% growth, nominal GDP will grow to Rs 210 trillion.
Bond maturities for fiscal 2019-20 are Rs 2.46 trillion and adding this to net borrowing of Rs 4.17 trillion, gross borrowing works out to Rs 6.63 trillion, which is higher than the revised borrowing numbers of Rs 5.35 trillion for fiscal 2018-19. The government lowered the borrowing by Rs 700 billion on optimism over inflows from small savings schemes.
Assumptions for nominal GDP growth, fiscal deficit and borrowing to fund the deficit can be varied but in all probabilities even in the best case scenario, borrowing will most likely be higher than the last year.
Bond markets will also worry over supply off take as banks SLR will fall by 125bps from 19.25% to 18%. RBI may not buy bonds as aggressively as it did this fiscal year and both these factors could push up bond yields if borrowing is deemed as high by the markets.
The 10-year benchmark government bond, the 7.26% 2029 bond, saw yields close 2 bps up at 7.33% on weekly basis. The benchmark 5-year bond, the 7.37% 2023 bond saw yields close 6 bps down at 7.25% and the 6.68% 2031 bond yields close 2 bps down at 7.70%. The long bond, the 7.06% 2046 bond yields close 5 bps down at 7.66% on weekly basis. Government bond yields are likely to rise further as market turns cautious into the budget.
OIS market saw one year yield close down by 4 bps and five year OIS yield close down by 10 bps last week. One-year OIS yield closed at 6.50% while five-year OIS yield closed at 6.64%.
System liquidity as measured by bids for Repo, Reverse Repo, Term Repo and Term Reverse Repo in the LAF (Liquidity Adjustment Facility) auctions of the RBI and drawdown from Standing Facility (MSF or Marginal Standing Facility) and MSS/CMB bond issuance was in deficit of Rs 720 billion as of 25th January 2019. Liquidity was in a deficit of Rs 642 billion as of 18th January 2019.
Total Corporate bonds outstanding touches record levels of Rs 29.48 trillion
As on December 2018, total corporate bonds outstanding was Rs 29.48 trillion, up by 11.37% against Rs 26.47 trillion in December 2017 and higher by 3.87% against Rs 28.38 trillion in September 2018.
• As on 25th January, FII debt utilisation status stood at 57.39% of total limits, 9 bps lower against the previous week. FII investment position was at Rs 4096 billion in INR debt.FII investment position stands at Rs 2059 billion in gilt securities that also includes investment in Interest Rate Futures and at Rs 2037 billion in corporate bonds.
• For the week ended 25th January, credit spreads were mixed. Three-year AAA corporate bonds were trading at levels of 8.50%, spreads were 1 bps higher at 138 bps against the previous week.
• Five-year AAA corporate bonds were trading at levels of 8.73%. Spreads were 7 bps higher at 130 bps.
• Ten-year AAA corporate bonds were trading at levels of 8.85% with spreads 5 bps higher at 139 bps.
• Three months and twelve months PSU bank CD yields were trading at 6.92% and 7.88% levels at spreads of 38 bps and 111 bps respectively against T-bill yields.
• Three months’ maturity Manufacturing and NBFC sector CPs were trading at 7.03% and 7.55% levels respectively. One-year maturity Manufacturing and NBFC sector CPs were trading at 8.27% and 8.50% levels respectively.
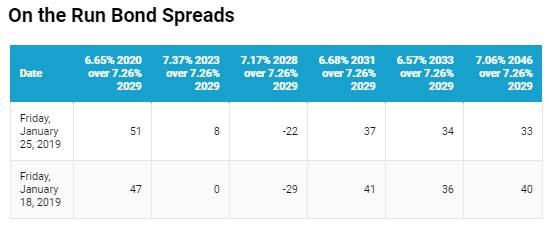
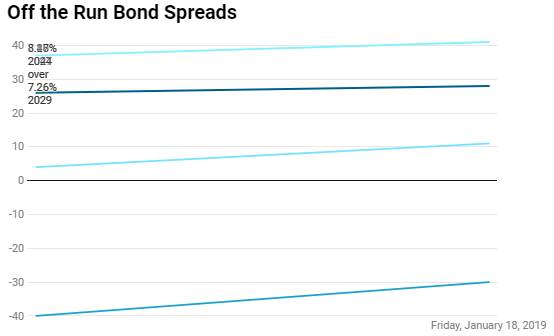
Weekly G-sec Curve Spread Analysis
• The yield curve flattened at the long end as the new 10-year G-sec yield rose by 2 bps while other long end bond yields fell by 2-5 bps.
• Off the run bond spreads with the 10-year G-sec largely fell last week
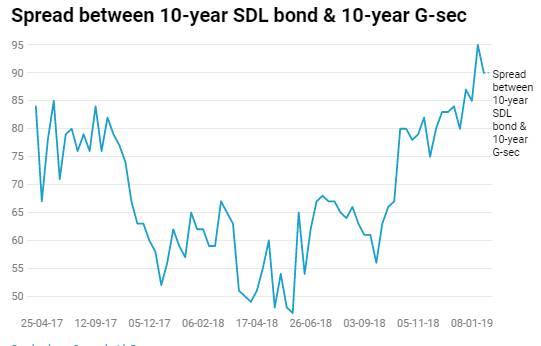
• On the 22nd January 2019 auction, the spread between SDLs with 10-year G-sec came in at 90 bps. On 15th January 2019 auction, the spread between SDLs with 10-year G-sec was at 95 bps.