Bond yields at the short end of the curve turned bullish on rate cut expectations in RBI April policy. CPI inflation for January printing lower than expected led to the sharp rise in rate cut expectations.
The benchmark 5 year government bond, the 7.37% 2023 bond saw yields falling by 11bps to close at 6.96% levels last week while the benchmark 10 year government bond, the 7.26% 2029 bond saw yields rise 6bps to close at 7.39%. The 5*10 segment of teh curve widened by 17bps to close at 43bps. The curve was flat just before RBI February policy rate cut and has steepened by 43bps since.
The bond markets are preferring to play the rate cut expectations at the short end of the curve, as the risk of supply on bond yields is lower. OIS yield curve has fallen and flattened with the 1*5 OIS spread closing last week at 6bps, down 4bps week on week.
One year CD yields and PSU and very high quality AAA (market perception) also saw sharp fall in yields. However, given the credit risk aversion on NBFCs and other issuers such as Essel and Reliance ADAG group, credit spreads largely rose.
Globally too, weak incoming economic data has driven down bond yields on expectations of central banks to stay accommodative. Read our report on Coordinated accommodation by Central Banks in 2019.
The worry for the bond market is only supply starting April 2019 and that can be addressed if RBI continues its bond buying spree to pump in liquidity. RBI has bought Rs 2.36 trillion of bonds this fiscal year to data and will buy more in the weeks to come.
Bond markets are likely to stay bullish at the short end of the curve and this can filter to the long end closer to end March on expectations of more bond buying by RBI next fiscal year.
The 10-year benchmark government bond, the 7.26% 2029 bond, saw yields close 6 bps up at 7.39% on weekly basis. The benchmark 5-year bond, the 7.37% 2023 bond saw yields close 11 bps down at 6.96% and the 6.68% 2031 bond yields close 2 bps up at 7.64%. The long bond, the 7.06% 2046 bond yields close 1 bps up at 7.68% on weekly basis. Government bond yields will trend lower on rate cut and RBI bond buying expectations.
OIS market saw one-year yield close down by 9 bps and five-year OIS yield close down by 13 bps last week. One-year OIS yield closed at 6.26% while five-year OIS yield closed at 6.32%. OIS yields will stabilize at current levels given the sharp fall in yields.
System liquidity as measured by bids for Repo, Reverse Repo, Term Repo and Term Reverse Repo in the LAF (Liquidity Adjustment Facility) auctions of the RBI and drawdown from Standing Facility (MSF or Marginal Standing Facility) and MSS/CMB bond issuance was in deficit of Rs 117 billion as of 15th February 2019. Liquidity was in a surplus of Rs 412.03 billion as of 8th February 2019. Liquidity will tighten on year end demand for funds by the system, advance tax outflows in March and rising demand for cash given May elections.
MFs Exposure to Real Estate Bonds Fell 16% in a Month
In January 2019, MFs exposure to real estate corporate bonds fell by 16% to Rs 76.29 billion against Rs 90.84 billion in December 2018.
As on 15th February, FII debt utilisation status stood at 56.99% of total limits, 3 bps lower against the previous week. FII investment position was at Rs 4068 billion in INR debt. FII investment position stands at Rs 2020 billion in gilt securities that also includes investment in Interest Rate Futures and at Rs 2047 billion in corporate bonds.
· For the week ended 15thFebruary, credit spreads were mixed.Three-year AAA corporate bonds were trading at levels of 8.40%, spreads were 1 bps lower at 150 bps against the previous week.
· Five-year AAA corporate bonds were trading at levels of 8.50%. Spreads were 7 bps higher at 133 bps.
· Ten-year AAA corporate bonds were trading at levels of 8.80% with spreads 4bps higher at 131 bps.
· Three months and twelve months PSU bank CD yields were trading at 7.05% and 7.73% levels at spreads of 70 bps and 126 bps respectively against T-bill yields.
· Three months’ maturity Manufacturing and NBFC sector CPs were trading at 7.35% and 7.68% levels respectively. One-year maturity Manufacturing and NBFC sector CPs were trading at 8.27% and 8.45% levels respectively.
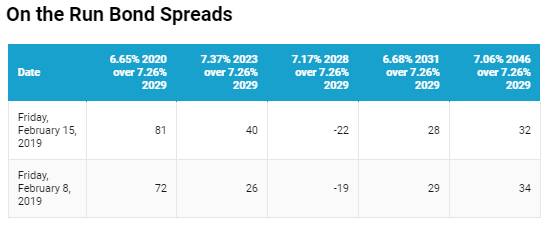
Weekly G-sec Curve Spread Analysis
· The yield curve flattened at the long end while it steepened at the short end, as the new 10-year G-sec yield rose by 5 bps while the short end bond yields fell by 6-11 bps and long end bond yields rose by 1-2bps. Most of the long end bonds largely remain untraded.
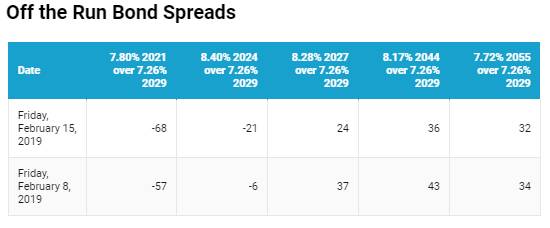
· Off the run bond spreads with the 10-year G-sec largely fell last week
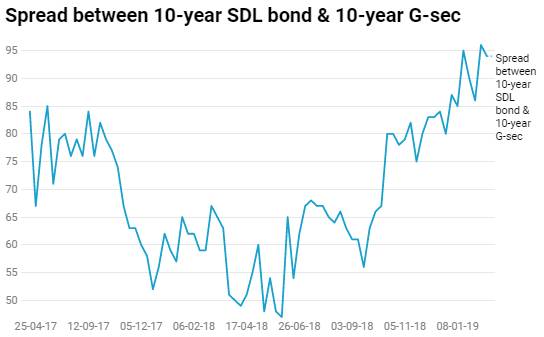
· On the 12th February 2019 auction, the spread between SDLs with 10-year G-sec came in at 94 bps. On 5th February 2019 auction, the spread between SDLs with 10-year G-sec was at 86 bps.