OIS (Overnight Indexed Swaps) yields fell sharply last week on rate cut optimism. One-year yield closed down by 10 bps and five-year OIS yield closed down by 18 bps last week. One-year OIS yield closed at 6.15% while five-year OIS yield closed at 6.16%, making the yield curve flat. The flatness of the curve indicates that interest rates are expected to stay down for a longer period of time, given slowdown in GDP growth and fall in inflation. GDP growth for the 3rd quarter of fiscal 2018-19 came in at 6.6% against full year estimates of 7.2% while CPI inflation for January 2019 printed at a 17 months low.
The fall in OIS yields also reflects optimism on a stable INR on the back of Fed willing to stay patient on rate hikes. US GDP grew stronger than expected for the 4th quarter of 2018 while inflation is not showing any alarming signs of rising faster than expected. Read our weekly Global Bond Market Analysis for details.
The fall in OIS yields was much sharper than the fall in government bond yields, which are still higher than lows seen post RBI policy. The 10 year benchmark government bond yield closed down 3bps last week, after rising sharply on the back of Indo-Pak tensions. The bond yield is around 14bps off lows since policy as the market frets on supply starting April 2019.
Government bond yields failed to take strength on RBI OMO purchase announcement for March, where it will buy Rs 250 billion of bonds in the 1st half of the month to add liquidity into the system.
Credits saw mixed movements with 3 year corporate bond yields falling and 10 year corporate bond yields rising. March is seeing good supply from states and also from PSUs and this is leading to rise in yields.
SEBI changed valuation norms for liquid funds, making funds mark to market all securities having maturity of over 30 days. This move will prompt CP and CD yields of over 30 days maturity to rise in a month of tight liquidity, as demand will be low for over 30 days maturity securities.
The 10-year benchmark government bond, the 7.26% 2029 bond, saw yields close 3 bps down at 7.38% on weekly basis. The benchmark 5-year bond, the 7.37% 2023 bond saw yields close 5 bps down at 6.96% and the 6.68% 2031 bond yields close 1 bps up at 7.70%. The long bond, the 7.06% 2046 bond saw yields stay flat at 7.68% on weekly basis.
System liquidity as measured by bids for Repo, Reverse Repo, Term Repo and Term Reverse Repo in the LAF (Liquidity Adjustment Facility) auctions of the RBI and drawdown from Standing Facility (MSF or Marginal Standing Facility) and MSS/CMB bond issuance was in deficit of Rs 28 billion as of 1st March 2019. Liquidity was in a deficit of Rs 747 billion as of 22nd February 2019.
Aggregate investment limit for the Voluntary Retention Route scheme in debt by FPIs at Rs 750 billion
RBI had announced a scheme called Voluntary Retention Route (VRR) to encourage FPIs to invest in long-term debt. Under this scheme, FPIs are given operational flexibility in terms of instrument choices and exemptions from certain regulatory requirements. The aggregate investment limit is 400 billion for investment in government securities and Rs 350 billion for investment in Corporate Debt Instruments, minimum retention period is three years.
As on 1st March, FII debt utilisation status stood at 55.88% of total limits, 81 bps lower against the previous week. FII investment position was at Rs 3988 billion in INR debt. FII investment position stands at Rs 1940 billion in gilt securities that also includes investment in Interest Rate Futures and at Rs 2047 billion in corporate bonds.
· For the week ended 1st March, credit spreads were mixed. Three-year AAA corporate bonds were trading at levels of 8.50%, spreads were 3 bps lower at 150 bps against the previous week.
· Five-year AAA corporate bonds were trading at levels of 8.60%. Spreads were 2 bps higher at 143 bps.
· Ten-year AAA corporate bonds were trading at levels of 8.95% with spreads 8 bps higher at 143 bps.
· Three months and twelve months PSU bank CD yields were trading at 7.24% and 7.70% levels at spreads of 85 bps and 119 bps respectively against T-bill yields.
· Three months’ maturity Manufacturing and NBFC sector CPs were trading at 7.44% and 7.73% levels respectively. One-year maturity Manufacturing and NBFC sector CPs were trading at 8.32% and 8.55% levels respectively.
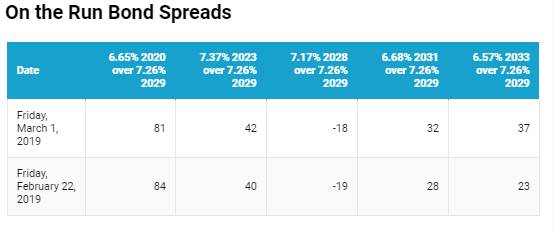
Weekly G-sec Curve Spread Analysis
· The yield curve steepened at the long end of the curve
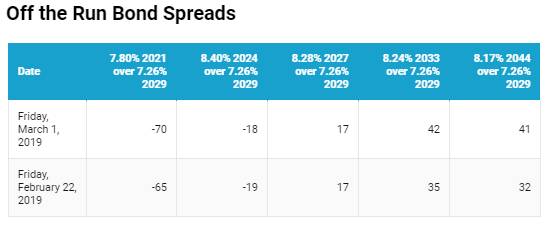
· Off the run bond spreads with the 10-year G-sec were mixed last week
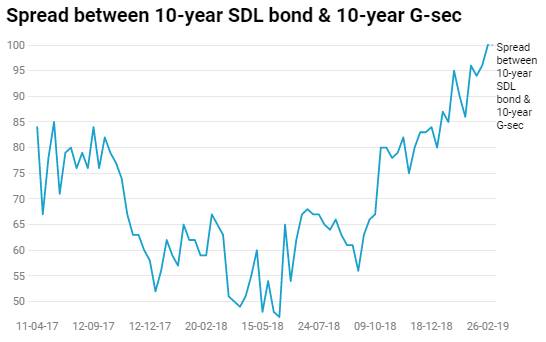
· On the 26th February 2019 auction, the spread between SDLs with 10-year G-sec came in at 100 bps. On 18th February 2019 auction, the spread between SDLs with 10-year G-sec was at 96 bps.