Credit markets saw a new lease of life after a prolonged period of nervousness post the IL&FS debt default in September 2018. A strengthening INR saw FIIs pumping in money into INR Bonds, giving RBI confidence to announce a USD 5 billion long term USD/INR swap auction on the 26th of March. Short end of the curve yields and spreads fell sharply on the back of easing market sentiments.
OIS yields too fell with one year OIS yield falling to levels of 6% and five year OIS yield falling to levels of 6.07%. OIS markets are bullish on rate cuts, strong INR and a dovish Fed.
The credit markets received a jolt of confidence from the RBI, as it announced a long term USD/INR swap auction to infuse long term liquidity into the system. The auction, if successful, can infuse around INR 350 billion of liquidity into the system, which will be of a long term nature given the 3 year maturity of the swap. RBI by using fx operations for liquidity is also expressing confidence that the INR will stay strong on fx flows and also it can shore up its reserves on a spot basis to confront any volatility in the market. This auction could also be a precursor to more auctions that would boost system liquidity.
Bond markets are also expecting a rate cut in April following low CPI inflation and weak IIP growth and export growth data. The market is also gaining strength on expectations of lower political risk and the present government being reelected in the May 2019 polls.
The markets will continue to search for yields, at least in highest safety bonds that have low risk of downgrades.
The 10-year benchmark government bond, the 7.26% 2029 bond, saw yields close 3 bps down at 7.34% on a weekly basis. The benchmark 5-year bond, the 7.37% 2023 bond saw yields close 7 bps down at 6.87% and the 6.68% 2031 bond yields close 1 bps down at 7.68%. The long bond, the 7.06% 2046 bond saw yields close 3 bps down at 7.70% on a weekly basis.
One-year yield closed down by 13 bps and five-year OIS yield closed down by 7 bps. One-year OIS yield closed at 6.00% while five-year OIS yield closed at 6.07%,
System liquidity as measured by bids for Repo, Reverse Repo, Term Repo and Term Reverse Repo in the LAF (Liquidity Adjustment Facility) auctions of the RBI and drawdown from Standing Facility (MSF or Marginal Standing Facility) and MSS/CMB bond issuance was in deficit of Rs 509 billion as of 15th March 2019. Liquidity was in a surplus of Rs 104 billion as of 8th March 2019.Advance tax outflows will keep liquidity in deficit.
Provident Funds ramp us exposure to SDLs
As on December 2018,Provident Funds exposure to SDLs was at Rs 5.68 trillion, which was 21.09% of total SDLs outstandings. Since December 2017, Provident Funds net exposure rose by Rs 1.70 triliion from Rs 3.97 trillion, which was 17.05% of total outstanding. In a year, exposure went up significantly by 4.24%.
As on 15th March, FII debt utilisation status stood at 56.94% of total limits, 44 bps higher against the previous week. FII investment position was at Rs 4064 billion in INR debt. FII investment position stands at Rs 1963 billion in gilt securities that also includes investment in Interest Rate Futures and at Rs 2100 billion in corporate bonds.
· For the week ended 15th March, credit spreads were down. Three-year AAA corporate bonds were trading at levels of 8.10%, spreads were 23 bps lower at 116 bps against the previous week.
· Five-year AAA corporate bonds were trading at levels of 8.35%. Spreads were 4 bps lower at 128 bps.
· Ten-year AAA corporate bonds were trading at levels of 8.70% with spreads 10 bps lower at 122 bps.
· Three months and twelve months PSU bank CD yields were trading at 7.11% and 7.50% levels at spreads of 81 bps and 110 bps respectively against T-bill yields.
· Three months’ maturity Manufacturing and NBFC sector CPs were trading at 7.28% and 7.58% levels respectively. One-year maturity Manufacturing and NBFC sector CPs were trading at 7.92% and 8.05% levels respectively.
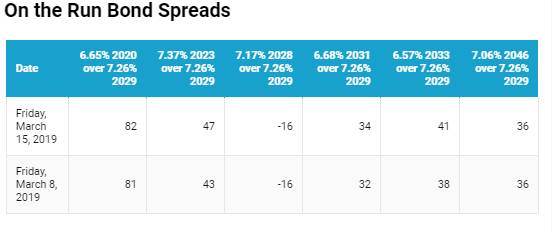
Weekly G-sec Curve Spread Analysis
· The yield curve steepened at both the long and short end of the curve, as short end bond yields fell by 4-7 bps and long end bond yields fell by 1-3 bps while 10-year G-sec yields fell 3 bps.
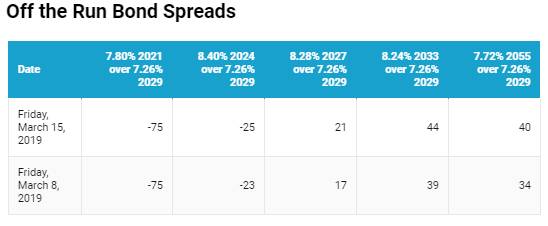
· Off the run bond spreads with the 10-year G-sec largely rose last week
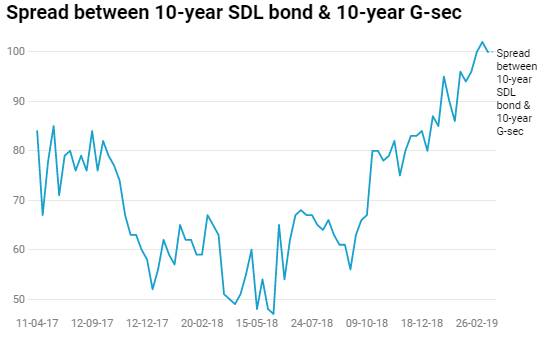
· On the 12th March 2019 auction, the spread between SDLs with 10-year G-sec came in at 100 bps. On 05th March 2019 auction, the spread between SDLs with 10-year G-sec was at 102 bps.