The bond market will brace for government bond and SDL supply of around Rs 250 billion to Rs 270billion on a weekly basis starting the 1st week of April. The government is borrowing around 62% of total borrowing for this 1st half of this year year, which is higher than the previous year, as the government chose to load the borrowing in the 2nd half of the last fiscal year.
The supply fears will be tempered by RBI rate cuts, if RBI cuts the Repo Rate by 25bps, as widely expected by markets. RBI would also announce liquidity infusion measures through a combination of OMO bond purchases and long term fx swaps, to help banks improve credit flow to the economy.
RBI policy actions would drive down yields at the short end of the credit curve, given that CP, CD and short maturity corporate bond yields are trading at 100bps to 175bps over the Repo Rate of 6.25%.
The sharp fall in OIS yields below 6% levels across the 1 year to 5 year segments of the curve point to easy interest rate and liquidity conditions, driven by both RBI and global central bank actions. Fed is almost through with rate hikes while ECB is turning more accommodative.
The election uncertainty and supply will keep government bond yields ranged at current levels.
Given that markets are expecting a 25ps rate cut, any negative surprise by the RBI could push up government bond yields by over 25bps and the yield curve could flatten over the 5 year to 10 year segment. Short end of the credit curve may not see a high impact given higher levels of spreads while the OIS curve could rise sharply.
The 10-year benchmark government bond, the 7.26% 2029 bond, saw yields close 1 bps up at 7.35% on a weekly basis. The benchmark 5-year bond, the 7.37% 2023 bond saw yields close 1 bps down at 6.85% and the 6.68% 2031 bond yield closed 4 bps down at 7.60%. The long bond, the 7.06% 2046 bond saw yields close 11 bps up at 7.60% on a weekly basis.
One-year OIS yield closed down by 10 bps and five-year OIS yield closed down by 14 bps. One-year OIS yield closed at 5.92% while five-year OIS yield closed at 5.94%
System liquidity as measured by bids for Repo, Reverse Repo, Term Repo and Term Reverse Repo in the LAF (Liquidity Adjustment Facility) auctions of the RBI and drawdown from Standing Facility (MSF or Marginal Standing Facility) and MSS/CMB bond issuance was in deficit of Rs 1465 billion as of 29th March 2019. Liquidity was in a deficit of Rs 1018 billion as of 22nd March 2019.
Mutual Fund’s exposure to CDs rose 9% while CPs declined 4%
As on February 2019, MFs preferred CDs over CPs. Total CDs exposure rose 9% to Rs 1.6 trillion from Rs 1.47 trillion in January while total CPs exposure declined to Rs 4.05 trillion from Rs 4.19 trillion in January.Real estate CPs exposure saw drastic drop of 38% to Rs 9.02 billion from Rs 14.54 billion in a month.
As on 29th March, FII debt utilisation status stood at 57.55% of total limits, 26 bps lower against the previous week. FII investment position was at Rs 4107 billion in INR debt. FII investment position stands at Rs 1935 billion in gilt securities that also includes investment in Interest Rate Futures and at Rs 2172 billion in corporate bonds.
· For the week ended 29th March, credit spreads were down. Three-year AAA corporate bonds were trading at levels of 8.00%, spreads were 15 bps lower at 111 bps against the previous week.
· Five-year AAA corporate bonds were trading at levels of 8.25%. Spreads were 6 bps lower at 120 bps.
· Ten-year AAA corporate bonds were trading at levels of 8.45% with spreads 16 bps lower at 99 bps.
· Three months and twelve months PSU bank CD yields were trading at 7.26% and 7.50% levels at spreads of 121 bps and 118 bps respectively against T-bill yields.
· Three months’ maturity Manufacturing and NBFC sector CPs were trading at 7.46% and 7.73% levels respectively. One-year maturity Manufacturing and NBFC sector CPs were trading at 7.97% and 8.17% levels respectively.
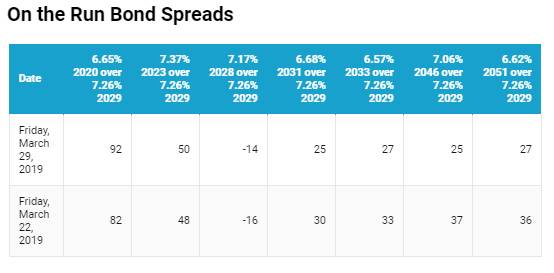
Weekly G-sec Curve Spread Analysis
· The yield curve flattened at the long end of the curve, as long end bond yields fell by 4-11 bps while 10-year G-sec yields rose by 1 bps.
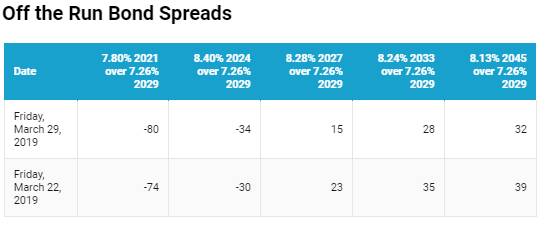
· Off the run bond spreads with the 10-year G-sec largely fell last week
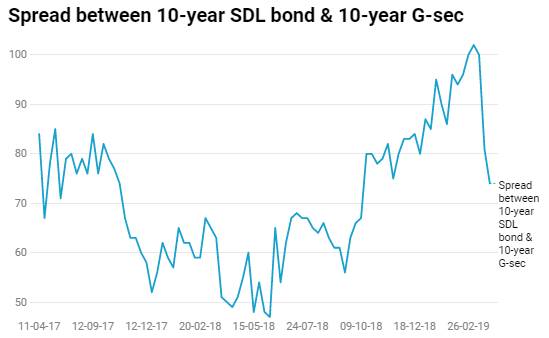
· On the 26th March 2019 auction, the spread between SDLs with 10-year G-sec came in at 74 bps. On 19th March 2019 auction, the spread between SDLs with 10-year G-sec was at 81 bps