The 10 year benchmark government bond gave up all its gains post RBI dividend to the government and closed the week 13bps higher from lows. Read our report on RBI dividend to government.
In Q1FY20 India’s GDP growth rate slowed to 5% against 8% in Q1FY19.The growth in the Agriculture, Mining, Manufacturing, Construction and Financial, Real Estate and Professional Services was at 2%, 2.7%, 0.6%, 5.7% , and 5.9%, respectively, for first quarter of FY20.
The market is still worried about higher borrowings by the government given the slowdown in GDP growth and tax collection as of April- July 2019 was 14.7% of budget estimates against 16% last year in the same period
Slowdown in economic growth impacts tax collections and disinvestment targets given weak markets and also the fiscal deficit tends to rise as % of GDP given that spending is same or higher while GDP growth is lower. This can impact headline fiscal deficit targets even if absolute levels of deficit is met.
Interest rates will stay low given weak demand conditions but higher bond supply can prevent yields at the longer end of the curve coming off, leading to a steepening of the yield curve.
The steepening of the domestic yield curve is in contrast to the inversion in the US treasury curve, where markets are playing for a weak growth to even a recession scenario. This is due to the domestic capability to absorb bond supply while US treasuries are globally held and moves on macro tunes.
Accessing the global markets for funding a small % of fiscal deficit can ease pressure on domestic savings to absorb supply and the yield curve can be more normalised as per the amcro economic conditions.
The 10-year benchmark government bond, the 7.26% 2029 bond, saw yields close 10 bps up at 6.57% on a weekly basis. The benchmark 5-year bond, the 7.32% 2024 bond saw yields close 5 bps lower at 6.28% and the 6.68% 2031 bond yield closed 1 bps higher at 6.84%. The long bond, the 7.63% 2059 bond, saw yields close up 5 bps at 6.97% levels.
One-year OIS yield closed down by 2 bps and five-year OIS yield closed down by 1 bps. One-year OIS yield closed at 5.18% while five-year OIS yield closed at 5.08%
System liquidity as measured by bids for Repo, Reverse Repo, Term Repo and Term Reverse Repo in the LAF (Liquidity Adjustment Facility) auctions of the RBI and drawdown from Standing Facility (MSF or Marginal Standing Facility) and MSS/CMB bond issuance was in surplus of Rs 1291 billion as of 23rd August 2019. Liquidity was in a surplusof Rs 1218 billion as of 23rd August 2019.
Weekly G-sec Curve Spread Analysis
· The yield curve steepened at the short end of the curve, as 10-year G-sec yield rose by 3 bps while short-end bond yields fell by 2-5 bps. (Table 1)
· Long end off the run bond spreads with the 10-year G-sec remained steady last week
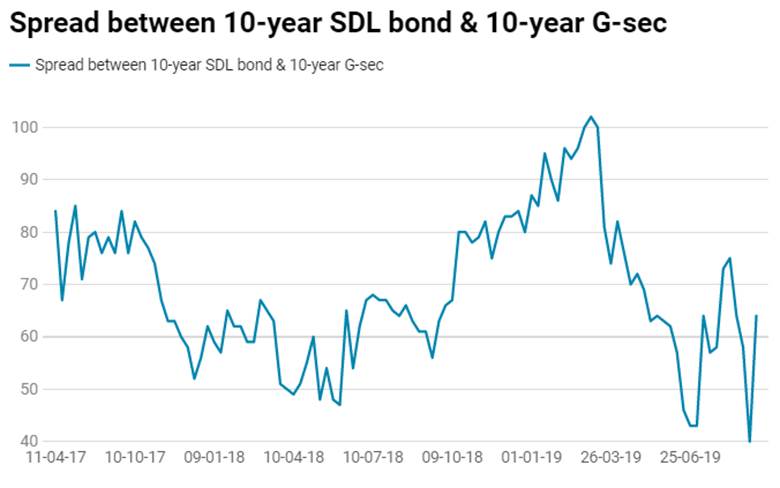
· On the 20th August 2019 auction, the spread between SDL with 10-year G-sec came in at 59 bps,states borrowed Rs 59.50 billion last week through SDLs auction. On 13th August 2019 auction, the spread between SDLs with 10-year G-sec was at 65 bps.