Rate cut by the RBI in its August policy review is almost certain on the back of the government lowering the fiscal deficit from 3.4% of GDP to 3.3% of GDP for this fiscal year in its budget presented on the 5th of July. RBI policy minutes for June suggested that MPC members were concerned on the fiscal front for further policy accommodation.
Globally too, the Fed is expected to start cutting rates this month while ECB could again pump in huge liquidity through bond purchases. Even though US Non Farm payrolls came in better than expected for June, wage growth was tepid. Read our Global Currency and Bond Market Report for details. UST yield curve is inverted with 3 month treasury yields trading higher than the rest of the curve upto 10 years, indicating expectations of sharp cuts in Fed Funds rate.
Given the bullish bond market budget where the government announced issuance of foreign currency bonds as part of its borrowing program, which will take away domestic supply, and give rate cut expectations, bond yield curves will drop sharply and markets will start to strategically position on the best curves and the best part of the curves for higher returns.
on the government bond yield curve, the 10 year benchmark bond trading at 6.69% levels is still inexpensive as it is trading at levels of close to 100bps over the repo while the 5 year bond too offers good value at 6.62% levels.
OIS yield curve is flat with one and five year OIS trading at 5.52% levels each and is already factoring in Repo at 5,25%, or a 50bps cut. The curve looks to be fairly valued but given global rate cut expectations, can still see further fall.
The credit curve is extremely inexpensive with spreads on the most liquid AAA bonds at levels of 80-100bps and going up to 150bps for NBFC bonds. One year CD and CP spreads too are highly attractive at 150bps to 220bps over Repo. Read our Weekly Credit Market Report for Details.
The 10-year benchmark government bond, the 7.26% 2029 bond, saw yields close 19 bps down at 6.69% on a weekly basis. The benchmark 5-year bond, the 7.32% 2024 bond saw yields close 15 bps down at 6.62% and the 6.68% 2031 bond yield closed 16 bps down at 6.88%. The long bond, the 7.72% 2049 bond, saw yields close down 5bps at 7.00% levels.
One-year OIS yield closed down by 7 bps and five-year OIS yield closed down by 15 bps. One-year OIS yield closed at 5.56% while five-year OIS yield closed at 5.52%
System liquidity as measured by bids for Repo, Reverse Repo, Term Repo and Term Reverse Repo in the LAF (Liquidity Adjustment Facility) auctions of the RBI and drawdown from Standing Facility (MSF or Marginal Standing Facility) and MSS/CMB bond issuance was in surplus of Rs 1493.55 billion as of 5th July 2019. Liquidity was in a deficit of Rs 54.70 billion as of 28th June 2019.
Weekly G-sec Curve Spread Analysis
· The yield curve steepened at the long end of the curve, as 10-year G-sec yield declined by 19 bps while the long-end bond yields fell by 12-15 bps. (Table 1)
· Long end off the run bond spreads with the 10-year G-sec rose last week
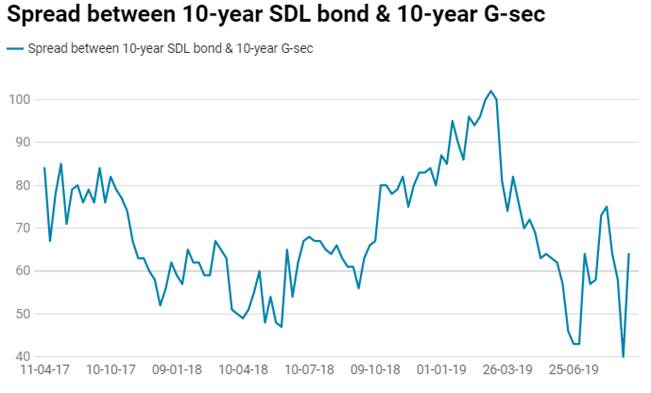
· On the 2nd July 2019 auction, the spread between SDL with 10-year G-sec came in at 43 bps,states borrowed Rs 137.87 billion last week through SDLs auction. On 25th June 2019 auction, the spread between SDLs with 10-year G-sec was at 43 bps.
·