RBI has pumped in Rs 1360 billion of primary liquidity into the system through OMO bond purchases and is planning to add Rs 400 billion more in December 2018. The liquidity infusion by the RBI is to lower system liquidity, which has been in negative since the last six months on the back of multiple factors including RBI fx sales, rising ICDR (Incremental Credit Deposit Ratio) and rise in currency in circulation. RBI has sold fx worth over Rs 1200 billion as the INR depreciated to all time lows on capital outflows. ICDR is at levels of 114% as credit growth has been well abover deposit growth. Currency in Circulation has risen by Rs 1800 billion this fiscal year so far on demonetization effects wearing off on currency supply.
On the other hand, RBI has raised the repo rate by 50bps from 6% levels to 6.5% levels even as the central bank signalled a shift from neutral policy to calibrated accommodation. RBI is unlikely to raise rates further in the next few meetings as CPI inflation is below its 4% target and oil prices have fallen substantially in the last two months by over 25%.
The Fed too has indicated that it may stall rate hikes in 2019 as it believes that the current rate, including a December 19th rate hike would be sufficient to keep the economy stable. US 10 year treasury yields have fallen to below 3% after crossing 3.2% levels. A dovish Fed will keep the USD from strengthening and lead to a better outlook for emerging market currencies. INR strengthened to below Rs 70 to the USD from lows of over Rs 74 on the back of fall in oil prices and Fed outlook for rates. FIIs too have turned net buyers in INR Bonds after being sellers for most of this fiscal year on better outlook for interest rates and currency.
RBI continuing to buy bonds even as the government is borrowing below budgeted levels will keep bond yields trending down. Stability in the repo rate at 6.5% levels in a better macro environment will flatten yield curves as markets search for yields.
Credit spreads are still high on risk aversion on NBFC credits and this will come off going forward on markets searching for yields.
The 10-year benchmark government bond, the 7.17% 2028 bond, saw yields close 11 bps down at 7.60% on weekly basis. The benchmark 5-year bond, the 7.37% 2023 bond saw yields close 8 bps down at 7.46% and the 6.68% 2031 bond saw yields close 9 bps down at 7.70%. The long bond, the 7.06% 2046 bond yields close 12 bps down at 7.86% on weekly basis.
OIS market saw one year yield close down by 3 bps and five year OIS yield close down by 5 bps last week. One year OIS yield closed at 6.92% while five year OIS yield closed at 7.11%. OIS yield curve could flatten further on falling UST yields and status quo on rates by RBI.
System liquidity as measured by bids for Repo, Reverse Repo, Term Repo and Term Reverse Repo in the LAF (Liquidity Adjustment Facility) auctions of the RBI and drawdown from Standing Facility (MSF or Marginal Standing Facility) and MSS/CMB bond issuance was in deficit of Rs 283 billion as of 30th November 2018. Liquidity was in a deficit of Rs 989 billion as of 22nd November 2018.
FIIs exposure to G-secs rising while staying stable for Corporate Bonds
Since 2nd November 2018, FIIs exposure to G-secs has risen 1.65% to Rs 2119 billion while corporate bonds exposure is stable at levels of Rs 1951 billion levels. As INR gained and crude prices fell in the last one month,FIIs raised exposure to G-secs.
· As on 29th November, FII debt utilisation status stood at 62.64% of total limits, flat against the previous week. FII investment position was at Rs 4070 billion in INR debt. FII investment position stands at Rs 2119 billion in gilt securities that also includes investment in Interest Rate Futures and at Rs 1951 billion in corporate bonds.
· For the week ended 29th November, credit spreads were down.Three-year AAA corporate bonds were trading at levels of 8.53%, spreads were 4 bps lower at 110 bps against the previous week.
· Five-year AAA corporate bonds were trading at levels of 8.60%. Spreads were 5 bps lower at 100 bps.
· Ten-year AAA corporate bonds were trading at levels of 8.60% with spreads 9 bps lower at 85 bps.
· Three months and twelve months PSU bank CD yields were trading at 7.08% and 8.30% levels at spreads of 35 bps and 112 bps respectively against T-bill yields.
· Three months’ maturity Manufacturing and NBFC sector CPs were trading at 7.14% and 7.61% levels respectively. One-year maturity Manufacturing and NBFC sector CPs were trading at 8.87% and 9.10% levels respectively.
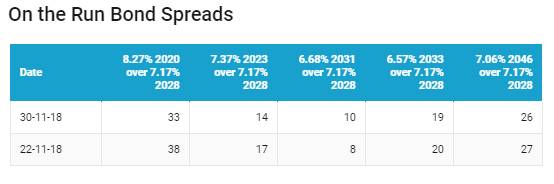
Weekly G-sec Curve Spread Analysis
· The yield curve flattened at the long end as 10-year G-sec yields fell by 11 bps while other long end bonds (6.57% 2033 & 7.06% 2046) yields fell by 12 bps.
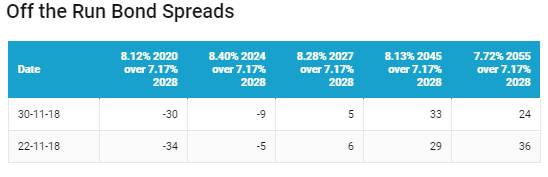
· Off the run bond spreads with the 10-year G-sec were mixed last week.
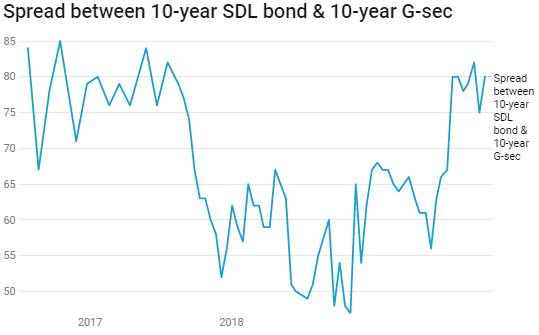
· On the 27th November 2018 auction, the spread between SDLs with 10-year G-sec came in at 80 bps. On 20th November 2018 auction, the spread between SDLs with 10-year G-sec was at 75 bps.