
State government borrowings are rising and rising fast. India’s state government borrowing at over Rs 4.07 trillion in fiscal 2017-18, is around 22% of total SDLs outstanding as of fiscal 2016-17, which was at Rs 18548 billion.UDAY bonds outstanding is at Rs 2.08 trillion.
SDL issuances are around 67% of gross government borrowing and together borrowings were over Rs 10 trillion in fiscal 2017-18 and will be higher in fiscal 2018-19. SDL spreads over government bonds are at around 60bps to 65bps and sustaining such spreads would require a good interest rate environment, which is not forthcoming. 10-year government bond yields have moved up by 100bps since October 2017 on worries of inflation and absorption of supply.
Banks are well over limits on SLR at over 30% of NDTL and may not have demand for SDL’s given that they will have to support the government borrowing program as well.
SDL spreads will have to be attractive for the market to absorb the supply and spreads may have to rise if demand is weak at current levels of spreads.
SDL
Maharashtra, Uttar Pradesh, Tamilnadu and West Bengal are major borrowers contributing to around 40% of total fiscal 2017-18 borrowing.
SDLs are perceived as risk-free given States access to the central government and RBI for funds to meet debt obligations if required. As of March 2018, 10 Year SDLs and 10 Year AAA Corporate Bonds are trading at almost similar spreads of 55-60 bps against the benchmark 10-year g-sec.
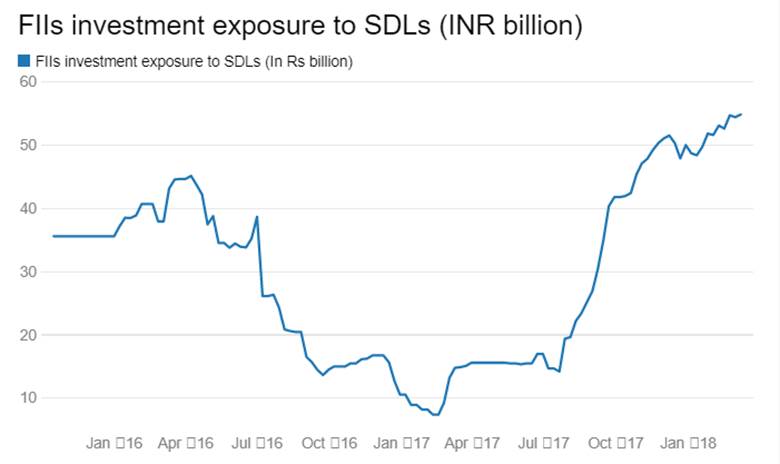
Corporate bonds are better than SDLs despite the latter’s risk-free perception and access to RBI Repo. Corporate bonds find more flavour with FII’s and mutual funds as they invest predominantly in corporate bonds with SDL’s forming a very low percentage of total fixed income investments.
SDLs are not as liquid as gsecs as they are not seen as trading bonds by traders. Banks and insurance companies are buy and hold investors while mutual funds hold them on opportunistic basis. FII limits have just opened up for SDL’s but utilization is low.
The redemption of special securities (UDAY) issued under financial restructuring plans (FRPs) for state-owned Discoms entails large repayment obligations from fiscal 2018-19. Special securities issued under FRPs are significantly larger in size; consequently, repayment pressure will be aggravated by 2018-19.
14th finance commission recommended that fiscal deficit of all states be anchored to an annual limit of 3% of GSDP during FY16 to FY 20 period. The GFD-GSDP ratio is budgeted at 2.6% during FY18 against 3.4% in FY17. State finances could deteriorate on an implementation of recommendations of states own pay commissions, farm loan waiver in some states and revenue uncertainty on account of the implementation of GST. On a comparable basis, the revised estimates of the GFD for fiscal 2016-17 were higher by 0.4% point over the budgeted ratio – raising concerns about potential fiscal slippage.
Maharashtra, Uttar Pradesh, Tamilnadu and West Bengal, which are major borrowers, have GFD-GSDP ratio of 1.6%, 3.9%, 3% and 3% for fiscal 2016-17 while Goa, Rajasthan, Jammu and Kashmir,Himachal Pradesh GFD ratios are at 6.8%, 5.6%, 8.8% and 4.6 %, far higher than the anchored target of 3%.
An analysis based on various indicators of debt sustainability in during FY13 to FY16 reveals that the rate of growth of debt of states at the aggregate level exceeded nominal GDP growth rate.
The old 10 year benchmark government bond, the 6.79% 2027 bond, saw yields fall by 13 bps week on week to close at levels of 7.73% while the new benchmark 10 year bond, the 7.17% 2028 bond, saw yields fall by 11bps to close at 7.56%. The on the run bond, the 6.79% 2029 bond saw yields close 7bps down at 7.65% levels and the 6.68% 2031 bond saw yields close down by 11bps at 7.82%. The long bond, the 7.06% 2046 bond saw yields close down 4bps at levels of 7.89%.
The OIS market saw 5 year OIS yields closing 4bps lower week on week at levels of 6.78%. The one year OIS yield closed down by 5bps at 6.45%.
Corporate bonds saw 5 year AAA corporate bond yields close down by 17bps at levels of 7.97% and 10 year AAA corporate bond yields close down by 7bps at 8.33%. 5 year AAA spreads fell by 9bps at 48bps and 10 year AAA spreads rose by 4bps at 77 bps. Credit spreads should see buying in the weeks leading into April, given the attractive levels.
System liquidity as measured by bids for Repo, Reverse Repo, Term Repo and Term Reverse Repo in the LAF (Liquidity Adjustment Facility) auctions of the RBI and drawdown from Standing Facility (MSF or Marginal Standing Facility) and MSS/CMB bond issuance was in surplus of Rs 64.18 billion as of 16th March 2018. The surplus was Rs 906 billion as of 9th March.