
At 3% yields, the spread between the US 10 year US treasury yield and the 10 year government of India bond is at levels of 475bps. The spread has increased over the last one year but is down over the last five years. Chart 1&2. At current spreads of 475bps, should the market buy or sell the spread?
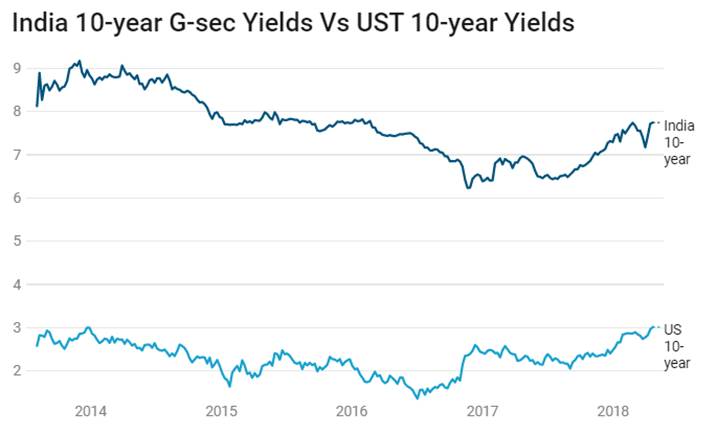
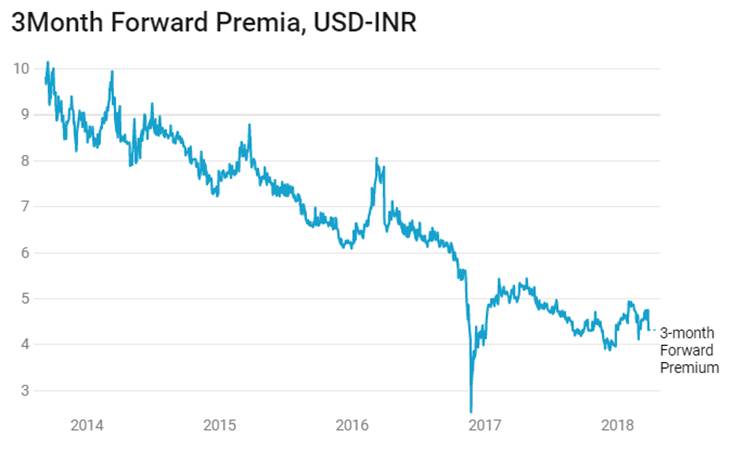
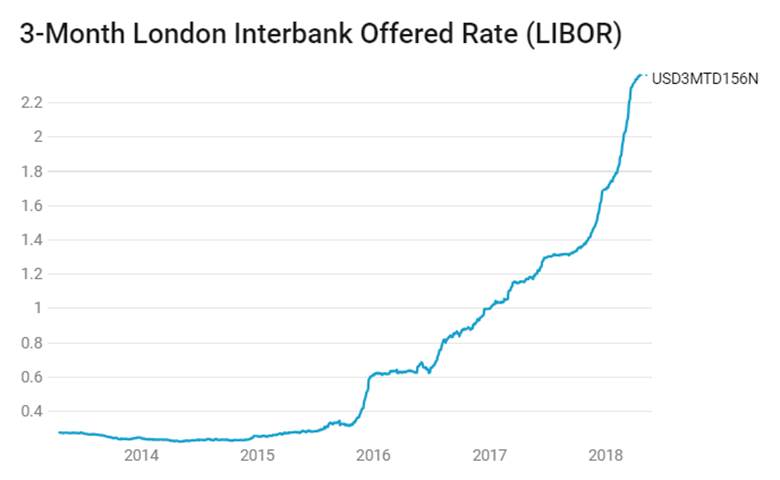
On a pure arbitrage basis, with 3 month Libor at 2.4% and 3 month USD/INR forward premia at 3.7%, there is carry available at around 175bps. This high carry would suggest that the spread is a sell and can contract if FIIs buy into the 10 year government bond at levels of 7.75% and spread of 175bps over the UST.
Looking independently at the 10 year UST and 10 year government bond, the 10 year government bond looks a better buy. The yield on the bond has risen by 150bps from lows seen in 2017 and with the Repo rate at 6% and likely to be held at 6% despite hawkish RBI Policy minutes the selling is overdone. Factors that led to the selling of the 10 year government bond include rising inflation expectations (belied by RBI in its April policy), banks selling of bonds, large state government borrowing in the 1st quarter of fiscal 2018-19, falling INR, rising oil prices, rising UST yields and risk aversion on worries of trade wars, bank scams and geo political issues.
The market has more or less factored in all negatives at 10 year government bond- repo spread of 175bps given that fx reserves are at record highs, system is easy on liquidity, government borrowing is low for the first half of this fiscal year and inflation expectations are down.
As far as the 10 year UST yield goes, the yield curve is flat and if Fed’s confidence on inflation and economic strength prevails, the curve is likely to steepen with further rise in 10 year UST yields. Read our note on Flat UST Yield Curve. Fed will stick to its guidance of 3 rate hikes this year, the first came in March and three more rate hikes next year, taking the Fed Funds rate to 3% by end of 2019.
Going by the view of 10 year government bond pricing in negatives and 10 year UST yet to price in rate hikes, inflation and growth, the spread is likely to contract.
The benchmark 10 year bond, the 7.17% 2028 bond, saw yields rise by 5 bps to close at 7.77%. The benchmark 5 year bond, the 7.37% 2023 bond saw yields rise by 22 bps to close at 7.78% and the 6.68% 2031 bond saw yields close up by 7 bps at 8%. The long bond, the 7.06% 2046 bond saw yields remain flat at levels of 7.73%.
The OIS market saw 5 year OIS yields closing 5 bps up week on week at levels of 7.04%. The one year OIS yield closed up by 3 bps at 6.60%. OIS yields will stay ranged on uncertain markets.
Corporate bonds saw 5 year AAA corporate bond yields close up by 28 bps at levels of 8.45% and 10 year AAA corporate bond yields close up by 8 bps at 8.45%. 5 year AAA spreads rose up by 6 bps at 67bps and 10 year AAA spreads rose by 3 bps at 68 bps. 5 year AAA credit spreads would fall given attractive levels of yields on the bonds.
System liquidity as measured by bids for Repo, Reverse Repo, Term Repo and Term Reverse Repo in the LAF (Liquidity Adjustment Facility) auctions of the RBI and drawdown from Standing Facility (MSF or Marginal Standing Facility) and MSS/CMB bond issuance was in surplus of Rs 120 billion as of 27th April 2018. Liquidity was in surplus of Rs 252 billion as of 20th April.