The October RBI policy decision of no rate hike was largely determined by the mess caused by IL&FS default. The worry for the RBI, Government and markets is that the IL&FS issue can spread into all markets, causing a credit squeeze in the economy that can derail economic growth.
The question is whether the IL&FS default is reflective of the whole NBFC sector and all other NBFCs barring a select few in trouble? The answer is No, IL&FS does not reflect the health of the NBFC sector as the issue is more of mismanagement, lack of accountability and lending to longer gestation infrastructure projects by borrowing short. IL&FS is an institutional issue and not a retail issue.
Retail lenders and housing finance companies lend in much smaller ticket sizes to individual borrowers. They also lend to corporate borrowers but this segment forms a smaller portion of the balance sheet. A look at the provisioning for bad loans of top NBFCs and HFCs indicate very low provisioning unlike those of banks who lent wholesale. NBFCs did write off loans post demonetization but that has made them start lending electronically and substantially reduce the cash portion of loans.
NBFCs have a mixed source of funding including banks, other NBFCs, Mutual Funds, Insurance Companies, Provident Funds and Trusts. The big NBFCs also have access to public deposits. The worry is how much of a asset liability mismatch they run and how much of extreme short term instruments such as CPs are maturing in the near term and whether they have liquidity to meet redemption?
NBFCs have been largely prudent in keeping liquidity post 2008 crisis and also due to the fact that yields have risen by 150bps to 200bps over the last 2 years, they have had time to adjust to the higher yields. Given that they do not have bad loans issues, servicing debt would not be an issue.
Retail loans are holding up well and that by itself should isolate the NBFC sector from IL&FS.
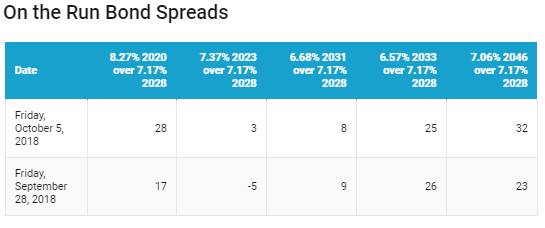
The 10-year benchmark government bond, the 7.17% 2028 bond, saw yields remain unchanged at 8.02% on weekly basis. The benchmark 5-year bond, the 7.37% 2023 bond saw yields close 9 bps down at 7.98% and the 6.68% 2031 bond saw yields close 1 bps down at 8.10%. The long bond, the 7.06% 2046 bond, saw yields close 9 bps up at 8.34%.
OIS market saw one year yield close down by 7 bps and five year OIS yield close up by 4 bps last week. One year OIS yield closed at 7.35% while five year OIS yield closed at 7.71%.
System liquidity as measured by bids for Repo, Reverse Repo, Term Repo and Term Reverse Repo in the LAF (Liquidity Adjustment Facility) auctions of the RBI and drawdown from Standing Facility (MSF or Marginal Standing Facility) and MSS/CMB bond issuance was in surplus of Rs 647 billion as of 5th October 2018. Liquidity was in a deficit of Rs 346 billion as of 28st September 2018.
FIIs hold 58% of total G-sec portfolio in less than 5 years maturity bonds
As on October 2018, FIIs hold Rs 2050.95 billion in G-sec,of which Rs 1200 billion are in G-secs having maturity of less than 5 years, forming 58% of total G-sec portfolio. FIIs sold INRBONDS for USD 6.93 billion in the first half of FY19. FIIs exposure to government securities has reduced by Rs 274 billion on the back of falling INR.
· As on 5th October, FII debt utilisation status stood at 62.71% of total limits, 637 bps lower against the previous week (as FII Investment limit has increased with total G-sec and Corporate bonds limit rising 9% to Rs 6499 billion). FII investment position was at Rs 4075 billion in INR debt. FII investment position stands at Rs 2075 billion in gilt securities that also includes investment in Interest Rate Futures and at Rs 2000 billion in corporate bonds.
· For the week ended 5th October,credit spreads rose post. Three-year AAA corporate bonds were trading at levels of 8.95%, spreads were 17 bps higher at 96 bps against previous week.
· Five-year AAA corporate bonds were trading at levels of 8.95%. Spreads were 8 bps higher at 80 bps.
· Ten-year AAA corporate bonds were trading at levels of 8.88% with spreads 13 bps higher at 70 bps.
· Three months and twelve months PSU bank CD yields were trading at 7.15% and 8.50% levels at spreads of 30 bps and 95 bps respectively against T-bill yields.
· Three months’ maturity Manufacturing and NBFC sector CPs were trading at 7.35% and 8.15% levels respectively. One-year maturity Manufacturing and NBFC sector CPs were trading at 8.75% and 9.00% levels respectively.