The bond market has had a difficult period for the whole of this fiscal year with sentiments being hurt by multiple factors of INR depreciation, FII selling, bond supply from centre and states, RBI rate hikes, rising oil prices and even a credit crisis on IL&FS default. Liquidity too has turned structurally negative.
The weak bond market sentiment pushed by bond yields to 4 years highs and it did look as if there was no respite for the bond market. However, many negative factors look to have played out and bond yields are unlikely to see very high levels of volatility going forward, unless there is a huge disruptive elemt to the market.
Markets will still be wary of RBI policy review on the 3rd and 4th of October, where the central bank is expected to raise rates by as much as 50bps. RBI will flag off higher inflation expectations on pass through of higher global oil prices, hike in customs duties by the government, higher cost of imports due to depreciating INR and pass through of higher raw material prices by manufacturers. RBI rate hike even by 50bps will take the repo rate to 7%, while bond yields are over 8% levels, indicating that markets have discounted multiple rate hikes.
The positives for the market is lower government borrowing for the 2nd half of this fiscal year, RBI infusing liquidity through bond purchases that will indirectly absorb supply, four more Fed rate hikes being priced into UST yields currently and easing tensions in global trade wars.
The government announced Rs 700 lower than budgeted borrowing for the October 2018- to March 2019 period. RBI has bough Rs 500 billion of bonds through OMOs to infuse liquidity that has fallen on the back of RBI fx sales and will buy more bonds given that banks credit growth at 13.5% against deposit growth of 8.6% as of 14th September 2018 has taken the ICDR (Incremental Credit Deposit Ratio) to over 100% causing further strain on liquidity. The credit crisis caused by IL&FS default has also increased the need to keep liquidity easy in the system.
RBI allowed banks to use SLR of 2% additionally for LCR purposes, easing pressure on banks needing to use markets to fund liquidity.
Fed hiked rates by 25bps last week and guided for four more rate hikes through beginning of 2020. Markets have been spared of uncertainty over Fed policy given the stance of Fed chair Jerome Powell and FOMC. Risk aversion on Fed policy will ease and will feed into markets globally. Trade war tensions between US and China have eased despite latest tariffs on more goods and this has fed into a equity rally, taking up global indices to record highs. Easing trade war tensions will calm fears on the INR.
Oil prices at USD 80/bbl are at multi year highs and while OPEC is not looking to increase production, at these levels there will be more shale oil produced in the US as well as many OPEC members bypassing oil output limits. Oil prices could stabilize at these levels.
The 10-year benchmark government bond, the 7.17% 2028 bond, saw yields close 6 bps down at 8.02% on weekly basis. The benchmark 5-year bond, the 7.37% 2023 bond saw yields close 2 bps down at 8.07% and the 6.68% 2031 bond saw yields close 8 bps down at 8.11%. The long bond, the 7.06% 2046 bond, saw yields close 6 bps down at 8.25%.
OIS market saw one year yield close down by 2 bps and five year OIS yield close down by 4 bps last week. One year OIS yield closed at 7.42% while five year OIS yield closed at 7.67%.
System liquidity as measured by bids for Repo, Reverse Repo, Term Repo and Term Reverse Repo in the LAF (Liquidity Adjustment Facility) auctions of the RBI and drawdown from Standing Facility (MSF or Marginal Standing Facility) and MSS/CMB bond issuance was in deficit of Rs 346 billion as of 28th September 2018. Liquidity was in a deficit of Rs 1485 billion as of 21st September 2018.
FIIs sold INRBONDS for USD 6.93 billion in H1FY19
FIIs sold INRBONDS for USD 6.93 billion in the first half of FY19. FIIs exposure to government securities and Corporate bonds reduced by Rs 274 billion and Rs 169 billion respectively. Falling INR prompted FIIs to sell INR Bonds, which further led to more INR weakness that is turn caused more FII selling. This selling will stop when global risk aversion eases., which does seem to be easing post Fed rate hike last week, as seen by record high levels of global equities.
· As on 28th September,FII debt utilisation status stood at 69.09% of total limits, 59 bps lower against the previous week. FII investment position was at Rs 4107 billion in INR debt. FII investment position stands at Rs 2089 billion in gilt securities that also includes investment in Interest Rate Futures and at Rs 2018 billion in corporate bonds.
· For the week ended 28th September,credit spreads were mixed.Three-year AAA corporate bonds were trading at levels of 8.90%, spreads were flat at 79 bps against previous week.
· Five-year AAA corporate bonds were trading at levels of 8.95%. Spreads were 7 bps lower at 72 bps.
· Ten-year AAA corporate bonds were trading at levels of 8.87% with spreads 3 bps lower at 66 bps.
· Three months and twelve months PSU bank CD yields were trading at 7.25% and 8.50% levels at spreads of 30 bps and 85 bps respectively against T-bill yields.
· Three months’ maturity Manufacturing and NBFC sector CPs were trading at 7.55% and 8.45% levels respectively. One-year maturity Manufacturing and NBFC sector CPs were trading at 8.95% and 9.25% levels respectively.
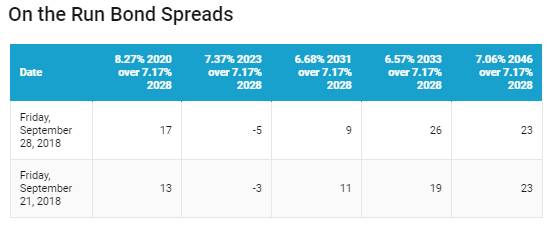
Weekly G-sec Curve Spread Analysis
· The yield curve was distorted, as 10-year bond yields fell by 6 bps while long-end bond yields, 6.68% 2031 & 7.06% 2046 bond yields, fell by 8bps & 6bps respectively. While 6.57% 2033 bond yields rose by 1bps.
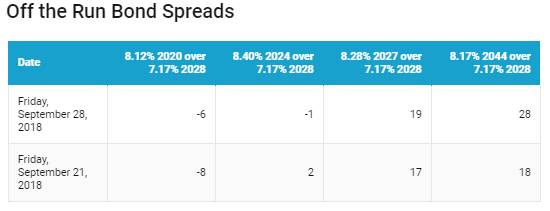
· Off the run bond spreads with the 10-year G-sec were mixed last week.
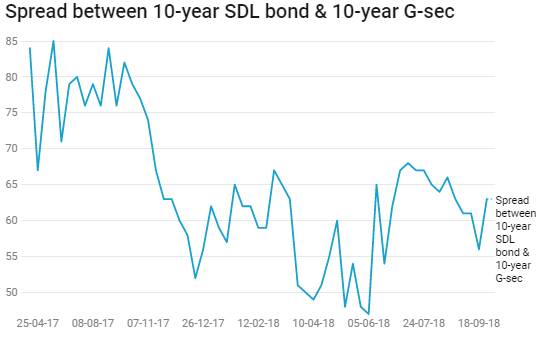
· On the 25th September 2018 auction, the spread between SDLs with 10-year G-sec came in at 63 bps. On 18th September 2018 auction, the spread between SDLs with 10-year G-sec was at 56 bps