Bond markets will see volatility rise in the month of September as the market braces for liquidity tightening, 2nd half government borrowing and RBI policy in the 1st week of October. Ten year gsec yields at levels of 7.87% would see yields trend higher and taking in its wake yields in the other segments of the market.
September is a month of traditional liquidity tightness with advance tax outflows and half yearly closing of accounts for banks. This year, liquidity has been affected by RBI fx sales with the INR falling to below Rs 70 to the USD. Currency in circulation too increases on festive season demand for cash.
Liquidity affects yields at the short end of the curve, especially money market securities yields. This time around, liquidity tightness would add to already nervous market sentiments that has been negatively hit by multiple factors of rate hikes, currency depreciation and worries on government finance.
The government will borrow bulk of its total fiscal year borrowing in the 2nd half of this fiscal year starting October 2018. The 2nd half usually sees rise in demand for credit post monsoons and liquidity is strained in the banking system. High levels of borrowing could be a challenge for the markets to absorb the borrowing without volatility in yields.
The weakening INR that fell to record lows against the USD last week would compound the negative market sentiments. RBI has been selling fx leading to reserves dropping by USD 20 billion over the last few months. INR weakness could also prompt more rate hikes by the RBI in its policy reviews. US Fed has indicated a steady rate hike path that could keep risk aversion high in global markets leading to steady FII selling of bonds.
RBI will step in with OMO purchase auctions to add liquidity into the system and also help the market create liquidity to absorb the higher bond supply.
Bond yields will trend higher but not on a sustained basis given already high level of yields and prospects of RBI OMO purchases.
The 10-year benchmark government bond, the 7.17% 2028 bond, saw yields close 1 bps up at 7.87% on weekly basis. The benchmark 5-year bond, the 7.37% 2023 bond saw yields close 2 bps up at 7.94% and the 6.68% 2031 bond saw yields close 1 bps up at 8.06%. The long bond, the 7.06% 2046 bond, saw yields close 13 bps up at 8.21%.
OIS market saw one year yield close down by 1 bps and five year OIS yield remain flat last week. One year OIS yield closed at 7.05% while five year OIS yield closed at 7.33%.
System liquidity as measured by bids for Repo, Reverse Repo, Term Repo and Term Reverse Repo in the LAF (Liquidity Adjustment Facility) auctions of the RBI and drawdown from Standing Facility (MSF or Marginal Standing Facility) and MSS/CMB bond issuance is in deficit of Rs 150 billion as of 24th August 2018. Liquidity was in surplus of Rs 185 billion as of 17th August 2018.
Private Placement of Corporate Bonds down 40%
In FY19 April-July period, private placement of corporate bonds was at Rs 1326 billion while in the previous year, same period. it was Rs 2215 billion. Private Placement of corporate bonds was down 40% year on year. Corporate bond issuance was down comparatively as interest rates have risen and surplus liquidity has decreased over the last one year.
· As on 24th August, FII debt utilisation status stood at 71.06% of total limits, 14 bps lower against the previous week. FII investment position was at Rs 4225 billion in INR debt. FII investment position stands at Rs 2164 billion in gilt securities that also includes investment in Interest Rate Futures and at Rs 2060 billion in corporate bonds.
· For the week ended 24th August, credit spreads fell. Three-year AAA corporate bonds were trading at levels of 8.53%, spreads were lower by 4 bps at 65 bps against previous week.
· Five-year AAA corporate bonds were trading at levels of 8.63%. Spreads were at 53 bps, 4 bps lower against last week.
· Ten-year AAA corporate bonds were trading at levels of 8.65% with spreads flat at 63 bps.
· Three months and twelve months PSU bank CDs were trading at 7.15% and 7.97% levels at spreads of 35 bps and 68 bps respectively against T-bill yields.
· Three months’ maturity Manufacturing and NBFC sector CPs were trading at 7.33% and 7.81% levels respectively. One-year maturity Manufacturing and NBFC sector CPs were trading at 8.30% and 8.50% levels respectively.
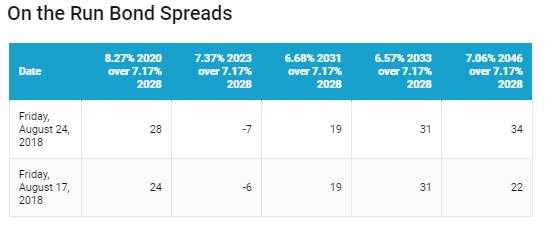
Weekly G-sec Curve Spread Analysis
· The yield curve steepened at the extreme long end of the curve, as 10-year bond yields rose by 1 bps while extreme long end bond yields (7.06% 2046) rose by 13 bps.
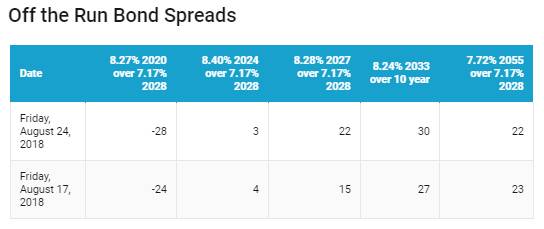
· Off the run bond spreads with the 10-year G-sec were mixed last week. (Table 2)
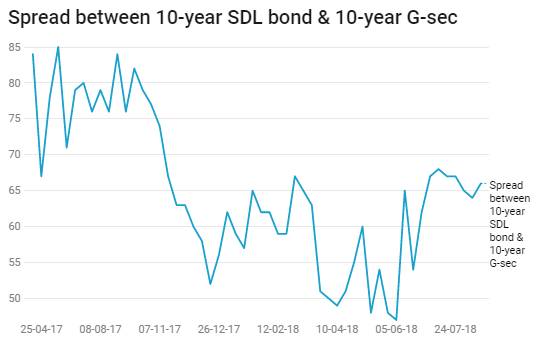
· On the 20th August 2018 auction, the spread between SDLs with 10-year G-sec came was at 66 bps. On 7th August 2018 auction, the spread between SDLs with 10-year G-sec was at 64 bps