RBI and the government must calm fears on Banks stability if markets are to trade normally. Fear provides opportunity for traders and investors to buy into higher yields but volatility will be high and one would have to have a strong heart to ride out the volatility.
· 10 year Gsec yield at 3 year highs
· 1 year Bank CD at 225bps over Repo
· 3, 5, 10 year AAA corporate bonds at 8.57%, 8.65% & 8.55% respectively, inverted curve
· 5 year OIS at 7.20%, indicating 4 rate hikes
The yields curves are suggesting that liquidity is going to tighten substantially and RBI will raise rates by at least 4 times. The picture painted by the levels of yields in the market is grim, as the market is trading on fear, which is brought about by the worries of stability of the PSU banks and a few private sector banks.
The 4th quarter of financial year 2017-18 performances of banks reflect mounting NPA issues and more banks are coming under RBI’s PCA (Prompt Corrective Action). PNB declared loss of over Rs 130 billion in the 4th quarter while banks such as Axis and ICICI Bank too showed high provisions for bad loans. PSU banks NPA’s are touching 25% of gross advances, a very high and worrisome number by any standards.
Banks are still the core of India’s financial system with deposits at over 65% of GDP and the market is worried about the balance sheets of banks. This is leading to both rising bond yields as banks are unwilling to buy more government bonds given that they hold 30% of deposits in bonds and deposit growth is at single digit levels and liquidity is getting drained through rise in currency in circulation that has risen by Rs 4,5 trillion over the last one year. On the other hand deposits have grown by Rs 9.2 trillion, half of bank deposits are going out of the system creating liquidity issues for banks as they have to maintain CRR, SLR and fund credit growth through incremental deposits.
The INR too has fallen to multi year lows of Rs 68 to the USD on worries of India’s banking system. RBI has been selling USD this month to prevent excessive INR volatility. RBI had bought USD 33.68 billion in fiscal 2017-18 and is now a net seller.
Bond market fear of banks coupled with 10 year UST yields rising over 3%, oil prices touching USD 80/bbl and India’s core CPI inflation for April 2018 printing at 5.9% have led to the high levels of yields across curves.
The benchmark 10 year bond, the 7.17% 2028 bond, saw yields rise by 10 bps at 7.83%. The benchmark 5 year bond, the 7.37% 2023 bond saw yields fall by 2 bps to close at 7.79% and the 6.68% 2031 bond saw yields rise by 12 bps at 8.07%. The long bond, the 7.06% 2046 bond saw yields close flat at levels of 7.73%.
The OIS market saw 5 year OIS yields closing 9 bps up week on week at levels of 7.19%. The one year OIS yield closed up by 11 bps at 6.75%. OIS yield curve could flatten on near term liquidity issues.
System liquidity as measured by bids for Repo, Reverse Repo, Term Repo and Term Reverse Repo in the LAF (Liquidity Adjustment Facility) auctions of the RBI and drawdown from Standing Facility (MSF or Marginal Standing Facility) and MSS/CMB bond issuance was in deficit of Rs 255 billion as of 11th May 2018. Liquidity was in surplus of Rs 71 billion as of 11th May 2018.
FIIs offloading INRBONDS,at USD 3.4 billion in current FY19
· Falling INR and rising UST yields have led to FIIs selling INR Bonds. Since April 2018 FIIs sold of USD 3.4.Continued weakness in INR and 10 year UST yields rising and staying above 3% could lead to more FII selling of INR Bonds. FII selling in an already weak market will lead to rise in yields across the government bond, corporate bond and money market yield curves.It is best to stay defensive till FII selling stops and market sentiments improve and at higher levels of yields bonds and money market securities will look attractive given 6% repo rate and easy system liquidity.
· As on 18th May, FII debt utilisation status stood at 72.75% of total limits,65 bps lower against the previous week. FII investment position was at Rs 4325 billion in INR debt. FII investment position stands at Rs 2265 billion in gilt securities that also includes investment in Interest Rate Futures and at Rs 2060 billion in corporate bonds.
· Three-year AAA corporate bonds were trading at levels of 8.59%, spreads rose 15 bps at 85 bps against previous week Three-year AAA NBFC bonds were trading at levels of 8.70% with spreads at 96 bps levels, 27 bps higher against previous week. Three-year AA+ NBFC bonds were trading at levels of 9.00% with spreads 22 bps higher against previous week at 126 bps levels.
· Five-year AAA corporate bonds were trading at levels of 8.75%. Spreads were at 81 bps, 27 bps higher against last week. Five-year AAA NBFC bonds were trading at levels of 8.77% with spreads at 83 bps,27 bps higher against previous week.
· Ten-year AAA corporate bonds were trading at levels of 8.63% with spreads 5 bps lower at 60 bps. Ten-year AAA NBFC bonds were trading at levels of 8.80% with spreads 10 bps higher at 77 bps.
10 year G-sec Volatility Steepens the Curve – Weekly G-sec Curve Spread Analysis
The long end of the G-sec curve spread with the 10-year G-sec largely rose last week, while the short end of the curve spread with 10-year G-sec was mixed, (Table 1).
Yield curve steepened as the 10-year G-sec (7.17% 2028) yield rose by 10 bps while other long end bond yields rose sharply by 12-16 bps.
10-year bond yield closed at 7.83%, bond yield rose on the back of rising oil prices, positive US economic data and 10 year UST yields trending beyond 3% levels.
The 10-year G-sec yield will trade at higher levels in the coming days due to global factors and domestic data that showed higher core inflation leading to fears of earlier than expected rate hikes by the RBI.
Off the run bond spreads with the 10-year G-sec were mixed last week. (Table 2)
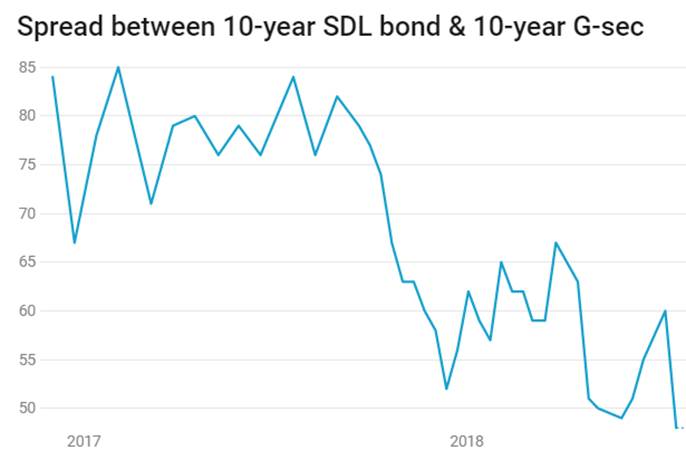
On the 15th May 2018 auction, the spread between SDL bonds with 10-year G-sec came in at 48 bps. In the 8th May 2018 auction, the spread between SDL bonds with 10-year G-sec came in at 60bps