RBI sold USD 6.18 billion in June 2018 and cumulatively has sold USD 14.34 billion in the Aprril – June 2018 period, taking out Rs 976 billion of liquidity in the process. Part of this liquidity was negated by maturity of RBI USD forward purchases.
System liquidity will come under pressure in September on advance tax outflows, first half year end demand for funds from the banking system and festive season demand for currency. Government spending has largely kept liquidity in surplus territory over the last one month. RBI OMO purchases of Rs 300 billion, this fiscal year to date has also helped liquidity. However, RBI will have to start becoming more aggressive on OMO purchases in order to keep liquidity easy in the system and funding needs will increase in the busy season that starts in October.
Money market securities of 1 month to 3 months maturity should see yields come under pressure in the next few weeks as system liquidity tightens and need for short term funding by corporates increase supply of papers. However, this spike in yields will be temporary as liquidity comes back to normal in October on government spending and banks release of half year end fund hoards.
Government bond yields will stay ranged on expectations of RBI OMOs while one year OIS yields will rise on liquidity worries.
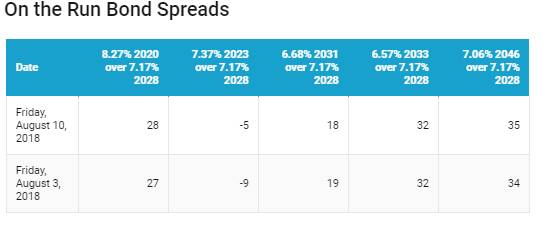
The 10-year benchmark government bond, the 7.17% 2028 bond, saw yields close 1 bps down at 7.75% on weekly basis. The benchmark 5-year bond, the 7.37% 2023 bond saw yields close 7 bps down at 7.80% and the 6.68% 2031 bond saw yields close 2 bps down at 7.93%. The long bond, the 7.06% 2046 bond, saw yields remain unchanged at 8.10%.
OIS market saw one year yield close down by 1 bps and five year OIS yield closed down by 1 bps last week. One year OIS yield closed at 6.95% while five year OIS yield closed at 7.24%.
System liquidity as measured by bids for Repo, Reverse Repo, Term Repo and Term Reverse Repo in the LAF (Liquidity Adjustment Facility) auctions of the RBI and drawdown from Standing Facility (MSF or Marginal Standing Facility) and MSS/CMB bond issuance was in surplus of Rs 460.87 billion as of 10th August 2018. Liquidity was in surplus of Rs 1013 billion as of 3rd August 2018.
Banks Investment in Private Corporate Sector bonds Rose 37.3% Year on Year
Banks investments in bonds or debentures issued by private corporate sector were at Rs 2216 billion June 2018,37.3% higher against the previous year while investments in PSUs bonds were at Rs 1291 billion, 16.71% higher. Banks have been investing in non SLR bonds on the back of weak credit risk appetite for loans.
· As on 10th August, FII debt utilisation status stood at 71.22% of total limits, 62 bps higher against the previous week. FII investment position was at Rs 4234 billion in INR debt. FII investment position stands at Rs 2175 billion in gilt securities that also includes investment in Interest Rate Futures and at Rs 2059 billion in corporate bonds.
· For the week ended 10th August, credit spreads rose. Three-year AAA corporate bonds were trading at levels of 8.48%, spreads were higher by 7 bps at 73 bps against previous week.
· Five-year AAA corporate bonds were trading at levels of 8.58%. Spreads were at 63 bps, 2 bps higher against last week.
· Ten-year AAA corporate bonds were trading at levels of 8.57% with spreads 1 bps higher at 67 bps.
· Three months and twelve months PSU bank CDs were trading at 7.10% and 7.90% levels at spreads of 38 bps and 65 bps respectively against T-bill yields.
· Three months’ maturity Manufacturing and NBFC sector CPs were trading at 7.23% and 7.70% levels respectively. One-year maturity Manufacturing and NBFC sector CPs were trading at 8.28% and 8.48% levels respectively.
Weekly G-sec Curve Spread Analysis
· The yield curve steepened at the extreme long end, as 10-year bond yields fell by 1 bps while extreme long bond yields were unchanged.
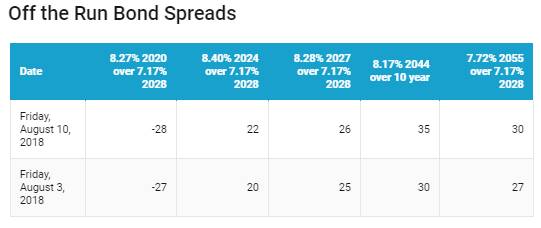
· Off the run bond spreads with the 10-year G-sec rose last week. (Table 2)
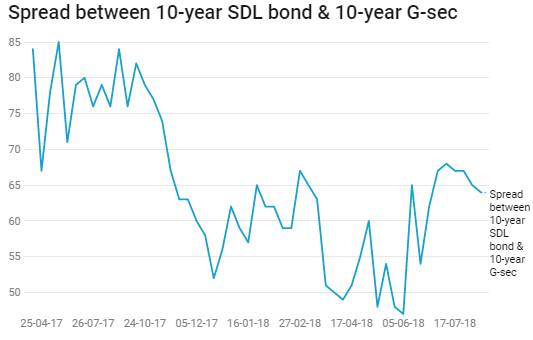
· On the 7th August 2018 auction, the spread between SDLs with 10-year G-sec came in at 64 bps. On 30th July 2018 auction, the spread between SDLs with 10-year G-sec was at 65 bps