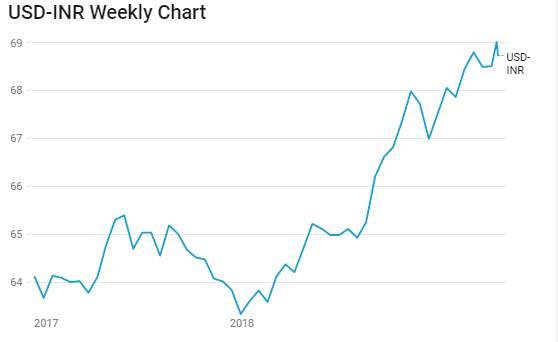
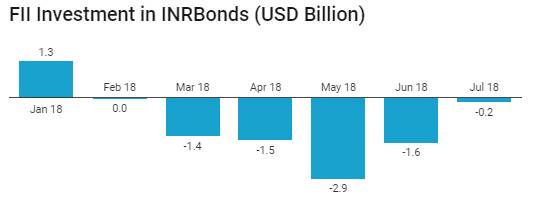
The falling INR (Chart 1) that closed at all time lows of below Rs 69 to the USD has impacted credit markets the most, especially at the short end of the yield curve. FIIs have been continuously selling INR Bonds (Chart 2) for the last five months, leading to sharp rise in bond yields across the curve. The short end of the credit curve is the most vulnerable to capital outflows as liquidity is impacted negatively and also on FII selling of short end of the curve credits.
3, 5 and 10 year AAA corporate bond yields have backed up by 150bps, 125bps and 100bps respectively over the last few months and are are trading at levels of 8.50%, 8.55% and 8.60% respectively and the levels over the repo rate are in the range of 225bps to 235bps. At these levels of Carry, corporate bond yields are factoring in a huge risk premium.
The risk premium should come off as the factors that drove the INR down and led to FII selling are losing intensity. The factors include
· Rising oil prices with brent crude touching USD 80/bbl leading to widening trade deficit
· Fed rate hikes leading to 10 year UST yield touching 3%
· Trade war fears leading to broad EM assets sell off
· RBI raising rates on higher inflation
· PSU bank crisis, demand for government bonds in auctions and liquidity
Oil prices have stabilised below USD 80/bbl on the back of US record production of shale oil, higher supplies expected from Saudi and Russia negating Iran sanctions and supply disruptions in countries like Venezuela and Lebanon.
Fed is on a gradual rate hike path and has guided for 2 more rate hikes this year. However, Fed is upbeat on the US economy, which is growing steadily without wage pressures despite low uncmployment rate. 10 year UST yields have fallen below 3% levels and is looking to stay down for a while
Trade war is causing concerns globally and China data suggests a weaker economy with GDP growth at 6.7% levels for the 2nd quarter of 2018. However, given the effect of trade wars on all economies, there will be a move towards negotiations, which will help ease fears of a full blown trade war.
RBI is expected to raise the repo rate by 25bps in August given core inflation for June 2018 coming in at 6.4%. Markets have discounted multiple rate hikes by the RBI given current levels of yields
PSU bank issues are still prominent with ballooning NPAs but with government starting to recapitalize banks, allowing acquisitions and speeding NCLT cases, the crisis is looking to be contained. Banks are still liquid with 29% of deposits in government bonds against SLR of 19.5%. RBI is buying bonds through OMO to ease liquidity and also to ease pressure on government bond auctions offtake.
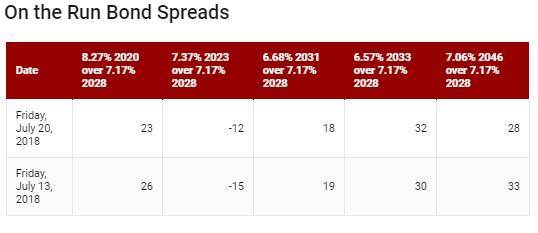
The 10-year benchmark government bond, the 7.17% 2028 bond, saw yields fall remain unchanged on weekly basis and close at levels of 7.79%. The benchmark 5-year bond, the 7.37% 2023 bond saw yields saw yields close 3 bps down at 7.91% and the 6.68% 2031 bond saw yields close 1 bps down at 7.97%. The long bond, the 7.06% 2046 bond, saw yields close 5 bps down at levels of 8.07%.
The OIS market saw 5 year OIS yields closing 2 bps up week on week at levels of 7.28%. The one year OIS yield closed up by 1 bps at 6.93%.
System liquidity as measured by bids for Repo, Reverse Repo, Term Repo and Term Reverse Repo in the LAF (Liquidity Adjustment Facility) auctions of the RBI and drawdown from Standing Facility (MSF or Marginal Standing Facility) and MSS/CMB bond issuance was in surplus of Rs 348 billion as of 20th July 2018. Liquidity was in surplus of Rs 572 billion as of 13th July 2018. Liquidity will ease on government spending.
Mutual Fund exposure to G-sec sreduced 5.9% in one month
Mutual Funds exposure to G-secs was at Rs 779 billion as on June 2018, 5.9% lower against May 2017 levels of Rs 829 billion. The rise in yields in government bonds has led to a significant drop in G-sec holdings of debt mutual funds.
· As on 20th July, FII debt utilisation status stood at 70.14% of total limits, 22 bps lower against the previous week. FII investment position was at Rs 4170 billion in INR debt. FII investment position stands at Rs 2115 billion in gilt securities that also includes investment in Interest Rate Futures and at Rs 2055 billion in corporate bonds.
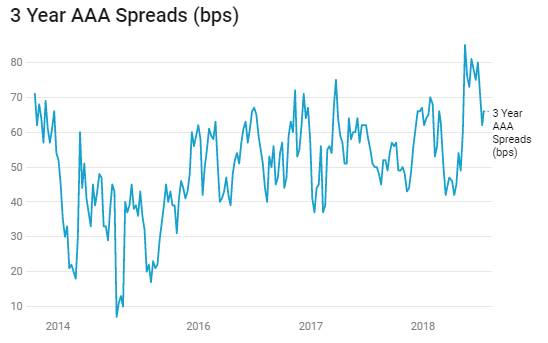
· For the week ended 20th July, credit spreads were mixed. Three-year AAA corporate bonds were trading at levels of 8.51%, spreads were higher by 4 bps at 66 bps against previous week.
· Five-year AAA corporate bonds were trading at levels of 8.59%. Spreads were at 53 bps, 6 bps lower against last week.
· Ten-year AAA corporate bonds were trading at levels of 8.60% with spreads at 66 bps.
· Three months and twelve months PSU bank CDs were trading at 6.90% and 8.05% levels at spreads of 42 bps and 70 bps respectively against T-bill yields.
· Three months’ maturity Manufacturing and NBFC sector CPs were trading at 7.00% and 7.57% levels respectively. One-year maturity Manufacturing and NBFC sector CPs were trading at 8.28% and 8.48% levels respectively.
Weekly G-sec Curve Spread Analysis
· The yield curve flattened, as 10-year bond yields remain unchanged while other long bond yields fell by 1-5 bps.
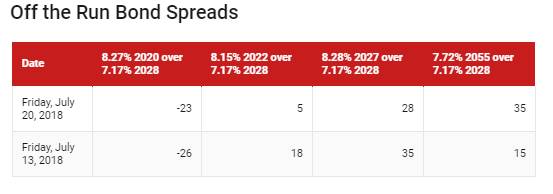
· Extreme long end & Off the run bond yields largely remain untraded.
· Off the run bond spreads with the 10-year G-sec were mixed last week. (Table 2)
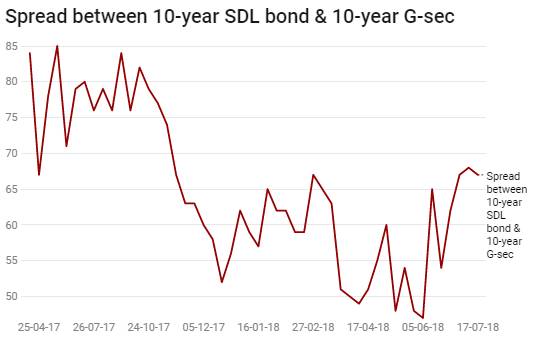
· On the 20th July 2018 auction, the spread between SDLs with 10-year G-sec came in at 67 bps. On 13th July 2018 auction, the spread between SDLs with 10-year G-sec was at 68 bps