The fact that bond yields have surged by 150bps from lows seen last year suggest that markets will not react to rate hikes by the RBI in its bi-monthly policy reviews. RBI is widely expected to hike rates in its policy meet outcome on the 1st of August 2018 on the back of core CPI inflation printing at 6.4%. 10 year benchmark bond yields closed down last week on the back of the markets buying into yields at higher levels.
However, bond yields are unlikely to trend down by much given FII selling of INR Bonds, rising trade deficit that is pressurising the INR, high bank ICDR levels of over 100% and higher chances of 2 more rate hikes by the Fed on latest CPI data.
FIIs have been lowering INR Bonds exposure and until this trend continues. bond market sentiment will stay uncertain. FII selling of bonds has pressurised the INR, which fell to its record low levels this month, Falling INR is hurting the country’s trade deficit that has risen in June on the back of higher oil imports. Weak capital flows coupled with rising trade deficit will hurt the BOP, leading to fall in reserves. India’s fx reserves have fallen from record highs on RBI sales of USD. Read our Liquidity Cheat Sheet for July on details of RBI fx operations.
Falling INR, rising trade deficit, higher crude oil prices can lead to a self fulfilling momentum that could lead to INR staying weak and FII’s selling more of INR Bonds.
Bank credit growth at 12.84% and deposit growth at 7.6% as of 22nd June 2018 has led to ICDR (Incremental Credit Deposit Ratio) at over 100%. Banks will sell government bonds, which they are holding at around 29% of NDTL to fund credit growth. Banks appetite for bonds could fall leading to higher yields in bond auctions.
US CPI inflation for June 2018 touched its highet level since 2012, leading to expectations that the Fed will hike rates 2 more times this year, taking rate hikes to a total of 4 in 2018. Higher Fed funds rates can pressurise the INR further on worries of capital outflows.
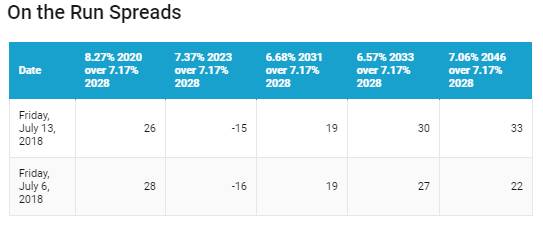
The 10-year benchmark government bond, the 7.17% 2028 bond, saw yields fall by 8 bps week on week to close at levels of 7.87%. The benchmark 5-year bond, the 7.37% 2023 bond saw yields saw yields close 8 bps down at 7.94% and the 6.68% 2031 bond saw yields close 8 bps down at 7.98%. The long bond, the 7.06% 2046 bond, saw yields close 3 bps up at levels of 8.12%. Bond yields will stay ranged in a 7.75% to 8% band.
OIS market saw one year yield close down by 6 bps and five year OIS yield closed down by 12 bps last week. One year OIS yield closed at 6.92% while five year OIS yield closed at 7.26%. OIS yields will follow government bond yields and trade in a range.
System liquidity as measured by bids for Repo, Reverse Repo, Term Repo and Term Reverse Repo in the LAF (Liquidity Adjustment Facility) auctions of the RBI and drawdown from Standing Facility (MSF or Marginal Standing Facility) and MSS/CMB bond issuance was in surplus of Rs 572 billion as of 13th July 2018. Liquidity was in surplus of Rs 1100 billion as of 6th July 2018. Liquidity will ease on government spending.
FIIs sold INRBONDS for over USD 6 billion in Q1FY19
FIIs sold INRBONDS for over USD 1 billion in the first quarter of FY19. FIIs exposure to government securities and Corporate bonds reduced by Rs 229 billion and Rs 153 billion respectively.Weak market sentiments,falling INR,risk aversion and Fed tightening rates caused FIIs to sell bonds.
· As on 13th July, FII debt utilisation status stood at 69.91% of total limits, 20 bps lower against the previous week. FII investment position was at Rs 4156 billion in INR debt. FII investment position stands at Rs 2115 billion in gilt securities that also includes investment in Interest Rate Futures and at Rs 2041 billion in corporate bonds.
· For the week ended 13th July, credit spreads were mixed. Three-year AAA corporate bonds were trading at levels of 8.52%, spreads were lower by 9 bps at 62 bps against previous week.
· Five-year AAA corporate bonds were trading at levels of 8.60%. Spreads were at 59 bps, 8 bps higher against last week.
· Ten-year AAA corporate bonds were trading at levels of 8.60% with spreads 6 bps higher at 66 bps.
· Three months and twelve months PSU bank CDs were trading at 6.90% and 8.05% levels at spreads of 37 bps and 86 bps respectively against T-bill yields.
· Three months’ maturity Manufacturing and NBFC sector CPs were trading at 7.00% and 7.57% levels respectively. One-year maturity Manufacturing and NBFC sector CPs were trading at 8.30% and 8.50% levels respectively.
Weekly G-sec Curve Spread Analysis
· The yield curve steepened, as 10-year bond yields fell sharply by 9 bps while other long bond yields fell by 6-8 bps.
· 10-year G-sec fell sharply as June 2018 inflation number came in below market estimates.
· The 10-year G-sec yield is trading lower than 5-year G-sec yields largely due to segmentation.
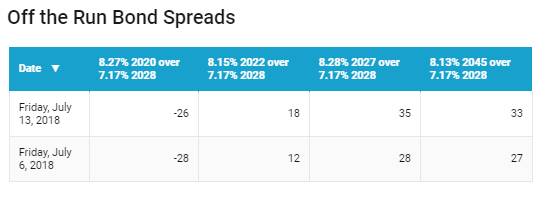
· Off the run bond spreads with the 10-year G-sec were mixed last week. (Table 2)
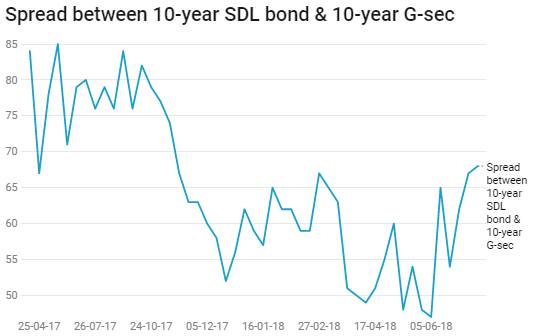
· On the 13th July 2018 auction, the spread between SDLs with 10-year G-sec came in at 68 bps. On 6th July 2018 auction, the spread between SDLs with 10-year G-sec was at 67 bps