Tax Collections Data & Monsoons to Calm Nervous Bond Markets
The government released robust tax collection numbers for the 1st quarter of 2018-19 through a FB post from Arun Jaitley. Direct tax collections grew 44% and corporate tax collections grew 17% in the 1st quarter of fiscal 2018-19 with good numbers showing on the tax to GDP ratio front. Tax to GDP ratio has increased by 1.5% over the last 4 years, which suggests that as GDP grows, direct tax revenues will see sharp increases. GST collections are expected to be over Rs 1 trillion a month going forward from Rs 900 billion a month, again a positive sign for the government’s fiscal.
The rise in direct tax collections indicates that the economy is not as bad as what markets make it out to be. Bond yields have risen by 150bps from lows seen last year on worries of government finances and inflation while the INR last week fell to record lows of over Rs 69 to the USD before taking back losses. Read our report on INR fall to record lows.
Government bonds and the INR have largely been affected by FII selling of INR Bonds and equities. FII’s sold India following a broad exit from emerging markets. Fed tightening, ECB stopping bond purchases, US – China trade war and China currency and equity sell off have troubled global markets that have gone on a risk aversion mode.
Government bond markets should see the 10 year benchmark government bond yield stabilizing at around 7.90% to 8% levels as it draws comfort from improving government finances and monsoons starting to cover the country, which is positive for lowering food inflation expectations. RBI June policy minutes suggest that the central bank will watch for data before taking any rate decisions, which is positive for bond yields, as RBI is in no rate hike spree following the 25bps hike in its June policy meet.
Bond yields will not come off in a hurry as markets will check for impact of government’s MSP poicy on inflation expectations. Global oil prices staying at higher levels post OPEC meet and trade war fears will also keep markets from becoming optimistic. Until oil prices stabilize and global risk aversion eases, bond yields will stay at higher levels though it will not climb.
The benchmark 10-year bond, the 7.17% 2028 bond, saw yields rise by 8 bps to close at 7.90%. The benchmark 5 year bond, the 7.37% 2023 bond saw yields saw yields close 10 bps up at 8.01% and the 6.68% 2031 bond saw yields close 8 bps up at 8.07%. The long bond, the 7.06% 2046 bond, saw yields close up 6bps at levels of 8.10%. Bond yields will stabilize at current levels.
The OIS market saw 5 year OIS yields closing 10 bps up week on week at levels of 7.33%. The one year OIS yield closed up by 10 bps at 6.94%. OIS yields will come off marginally on improved tax data.
System liquidity as measured by bids for Repo, Reverse Repo, Term Repo and Term Reverse Repo in the LAF (Liquidity Adjustment Facility) auctions of the RBI and drawdown from Standing Facility (MSF or Marginal Standing Facility) and MSS/CMB bond issuance was in surplus of Rs 182 billion as of 29th June 2018. Liquidity was in deficit of Rs 300 as of 22nd June 2018. Liquidity will ease on government spending.
Mutual Funds hold 87% of total Commercial papres
As on May 2018 Mutual funds holding of commercial papers stands at Rs 4088 billion,87% of total outstanding CPs. In January 2018, mutual funds held Rs 3638 billion or 79.5% of total outstanding CPs. Mutual Funds with strong flows into liquid and ultra short funds are showing high CP demand and corporates are funding working capital through CPs rather than bank lines.
· As on 29th June, FII debt utilisation status stood at 70.21% of total limits, 18 bps lower against the previous week. FII investment position was at Rs 4174 billion in INR debt. FII investment position stands at Rs 2138 billion in gilt securities that also includes investment in Interest Rate Futures and at Rs 2036 billion in corporate bonds.
· For the week ended 29th June, credit spreads were mixed. Three-year AAA corporate bonds were trading at levels of 8.7%, spreads were higher by 5 bps at 80 bps against previous week.
· Five-year AAA corporate bonds were trading at levels of 8.75%. Spreads were at 58 bps, 3 bps lower against last week.
· Ten-year AAA corporate bonds were trading at levels of 8.67% with spreads 1 bps lower at 62 bps.
· Three months and twelve months PSU bank CDs were trading at 6.86% and 8.08% levels at spreads of 42 bps and 97 bps respectively against T-bill yields.
· Three months’ maturity Manufacturing and NBFC sector CPs were trading at 7.03% and 7.60% levels respectively. One-year maturity Manufacturing and NBFC sector CPs were trading at 8.32% and 8.53% levels respectively.
Weekly G-sec Curve Spread Analysis
· The yield curve flattened at the long end, as 10-year bond yields rose sharply by 8 bps while other long bond yields rose by 6-7 bps.
· The 10-year G-sec (7.17% 2028) yield is trading lower than 5-year G-sec (7.37% 2023) yields .
· Off the run bond spreads with the 10-year G-sec were mixed last week.
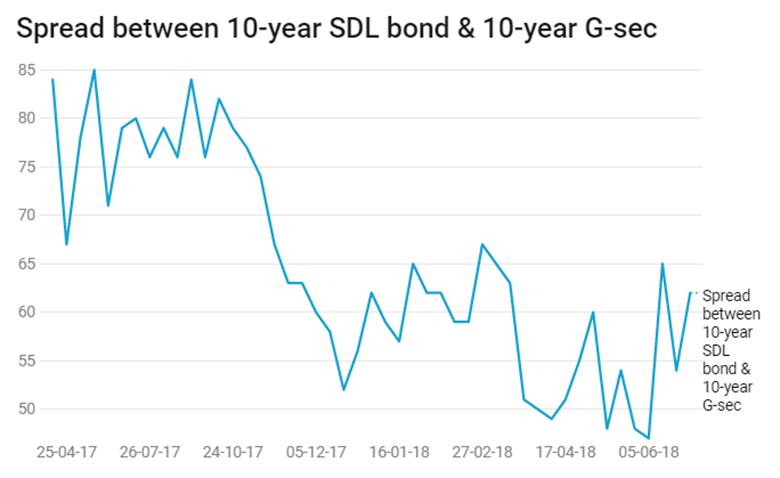
· On the 26th June 2018 auction, the spread between SDLs with 10-year G-sec came in at 62 bps. On 19th June 2018 auction, the spread between SDLs with 10-year G-sec was at 54 bps