RBI has been selling USD on the back of the INR closing at all time lows last week. Fx sales have sucked out liquidity of at least Rs 1 trillion. Read our Weekly Currency Market Analysis for details of RBI intervention. However, despite such heavy liquidity outflows, system liquidity went into surplus last week on the back of government spending. RBI OMO purchases of Rs 200 billion too has negated the liquidity outflow from fx sales to a certain extent.
The easing of system liquidity is positive for the credit curve, which is inverted with 3 year AAA corporate bond yields trading above 5 and 10 year AAA bond yields. The short end of the curve, 1 year CPs too are trading at 8.50% levels, 225bps over the repo rate. The flat to inverted credit curve suggests deep fears in the market on FII selling of INR Bonds due to INR weakness. Markets are also concerned about the level of fx sales by the RBI, as it has a permanent liquidity effect.
Easing liquidity on government spending will negate fears of a deep liquidity crunch in the system and this will prompt the market to play on the normalising of the credit curve. Curve normalisation may take time but at fear levels, the curve offer good opportunity for the market to lock into the curve for future gains.
Government bonds are living from auction to auction as levels of yields are deterring short sellers while uncertainty of INR and inflation on the back of MSP hike are keeping the market from buying into higher yields. Market volumes are low and there is a clear lack of trading interest. Bond yields will stay rangebound.
OIS yields too will stay ranged at current levels given that the curve is factoring in multiple rate hikes and look to have priced in the negatives in the market.
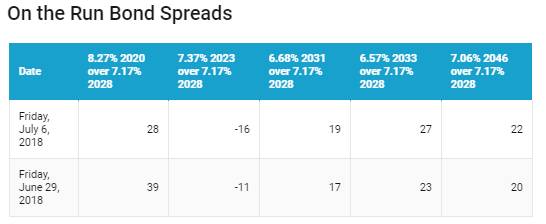
The 10-year benchmark government bond, the 7.17% 2028 bond, saw yields fall by 3bps week on week to close at levels of 7.87%. The benchmark 5-year bond, the 7.37% 2023 bond saw yields saw yields close 2 bps up at 8.03% and the 6.68% 2031 bond saw yields close 1 bps down at 8.06%. The long bond, the 7.06% 2046 bond, saw yields close down 1 bps at levels of 8.09%.
The OIS market saw 5 year OIS yields closing 5 bps up week on week at levels of 7.38%. The one year OIS yield closed up by 4 bps at 6.98%.
System liquidity as measured by bids for Repo, Reverse Repo, Term Repo and Term Reverse Repo in the LAF (Liquidity Adjustment Facility) auctions of the RBI and drawdown from Standing Facility (MSF or Marginal Standing Facility) and MSS/CMB bond issuance was in surplus of Rs 900 billion as of 6th July 2018. Liquidity was in deficit of Rs 182 billion as of 29th June 2018. Liquidity will ease on government spending.
Mutual Funds hold 87% of total Commercial Paper Outstanding
As on May 2018, Mutual funds holding of commercial papers stands at Rs 4088 billion, which is 87% of total outstanding CPs. In January 2018, mutual funds held Rs 3638 billion or 79.5% of total outstanding CPs. Mutual Funds with strong flows into liquid and ultra short funds are showing high CP demand and corporates are funding working capital through CPs rather than bank lines.
· As on 29th June, FII debt utilisation status stood at 70.21% of total limits, 18 bps lower against the previous week. FII investment position was at Rs 4174 billion in INR debt. FII investment position stands at Rs 2138 billion in gilt securities that also includes investment in Interest Rate Futures and at Rs 2036 billion in corporate bonds.
· For the week ended 29th June, credit spreads were mixed. Three-year AAA corporate bonds were trading at levels of 8.7%, spreads were higher by 5 bps at 80 bps against previous week.
· Five-year AAA corporate bonds were trading at levels of 8.75%. Spreads were at 58 bps, 3 bps lower against last week.
· Ten-year AAA corporate bonds were trading at levels of 8.67% with spreads 1 bps lower at 62 bps.
· Three months and twelve months PSU bank CDs were trading at 6.86% and 8.08% levels at spreads of 42 bps and 97 bps respectively against T-bill yields.
· Three months’ maturity Manufacturing and NBFC sector CPs were trading at 7.03% and 7.60% levels respectively. One-year maturity Manufacturing and NBFC sector CPs were trading at 8.32% and 8.53% levels respectively.
Weekly G-sec Curve Spread Analysis
· The yield curve steepened, as 10-year bond yields fell by 3 bps while other long bond yields fell by 1-2 bps.
· The 10-year G-sec yield is trading lower than 5-year G-sec yields largely due to segmentation.
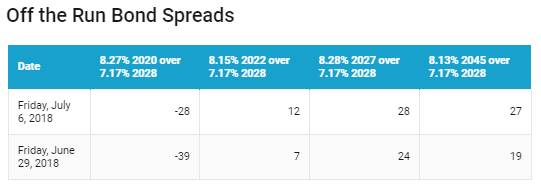
· Off the run bond spreads with the 10-year G-sec were mixed last week. (Table 2)
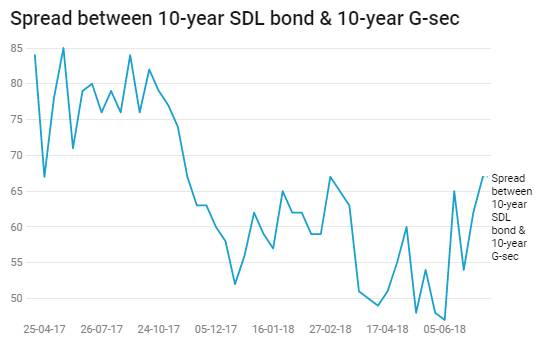
· On the 6th July 2018 auction, the spread between SDLs with 10-year G-sec came in at 67 bps. On 26th June 2018 auction, the spread between SDLs with 10-year G-sec was at 62 bps