A study of RBI Rate Cuts over the 2000-2017 period reveals that this current rate cut cycle has more steam left. The 2015-2017 to some extent resembles the 2001-2004 period of easing with similar issues of NPA’s, weak economic growth and low inflation expectations. 10 year Gsec yields can trend down further on sustained easing.
RBI Rate Cuts since 2000
RBI Rate Cut months – August 2017, October 2016, April 2016, September 2015, January 2015, May 2013, March 2013, January 2013, April 2012, April 2009, March 2009, January 2009, December 2008, November 2008, October 2008, March 2004, March 2003, November 2002, March 2002, June 2001, April 2001
Rate Cut Years – 2001,2002,2003,2004,2008,2009,2012,2013,2015,2016,2017
Rate Cut Period 2001-2004 (All charts are given at the end)
RBI had two periods of sustained rate cuts and two periods of short rate cuts since the year 2000. The first period of sustained rate cuts was in the 2001-2004 period, as the economy needed a monetary boost in the face of weak economic growth.
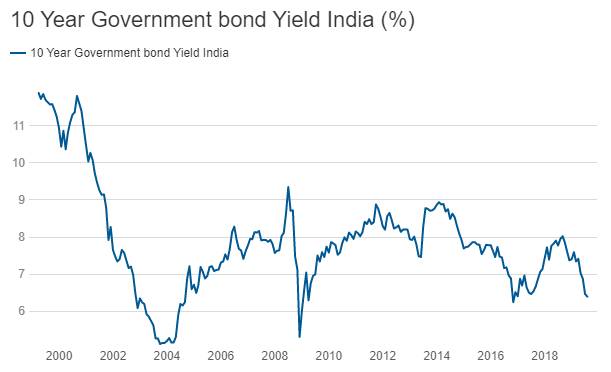
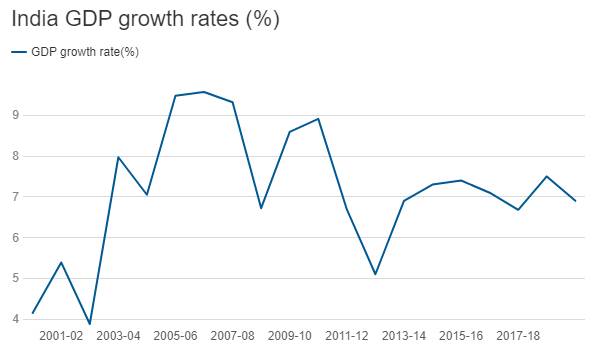
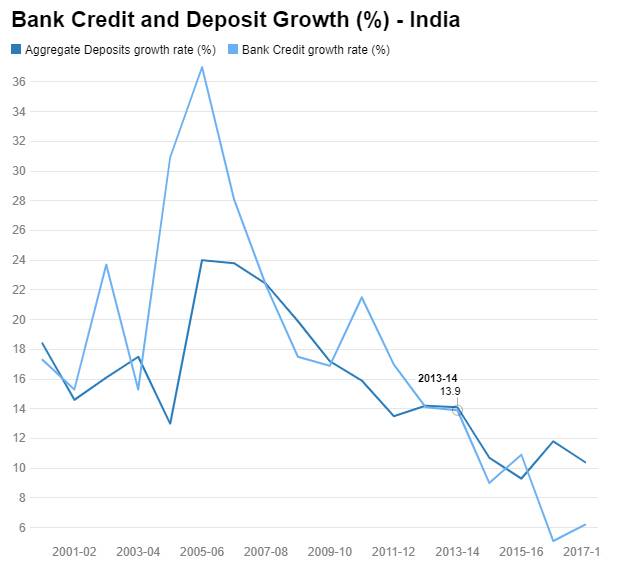
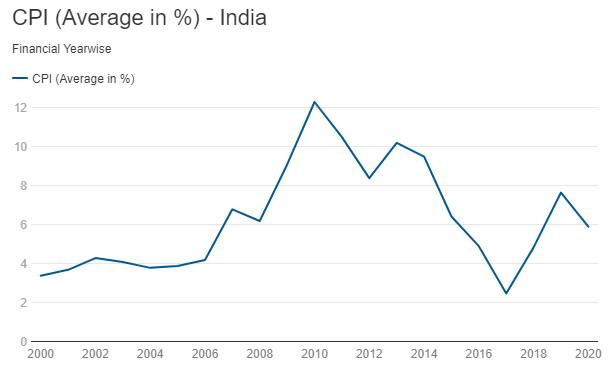
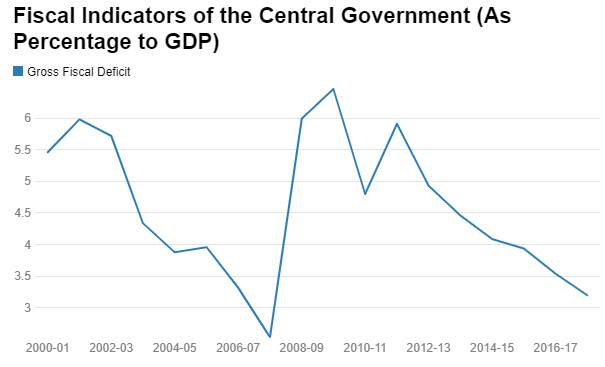
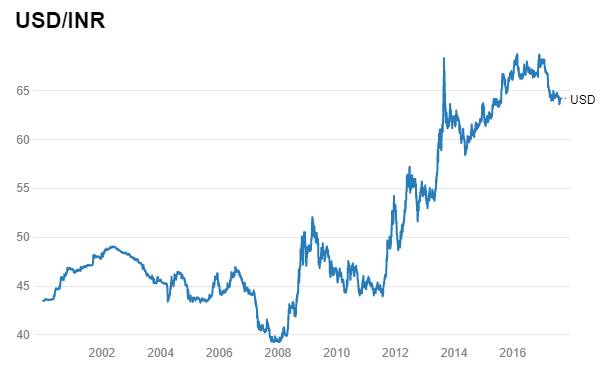
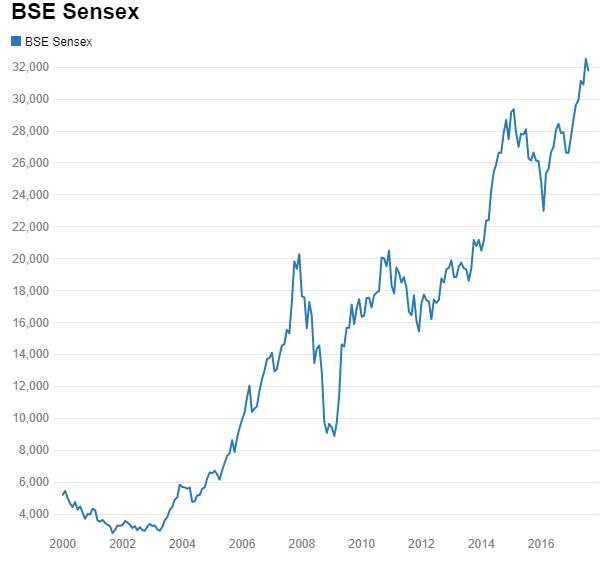
In the first repo rate cut cycle from 2001 to 2004, 10-year G-sec yields rallied from 11.9% levels to 5.2% levels. INR was largely flat, GDP growth started to move higher, CPI inflation was under control at sub 5% levels. Fiscal deficit as % of GDP fell from 6% levels to sub 4%. Bank credit and deposit growth rose during the period of stimulus. Sensex gained 52%.
RBI Rate Cut 2008-09
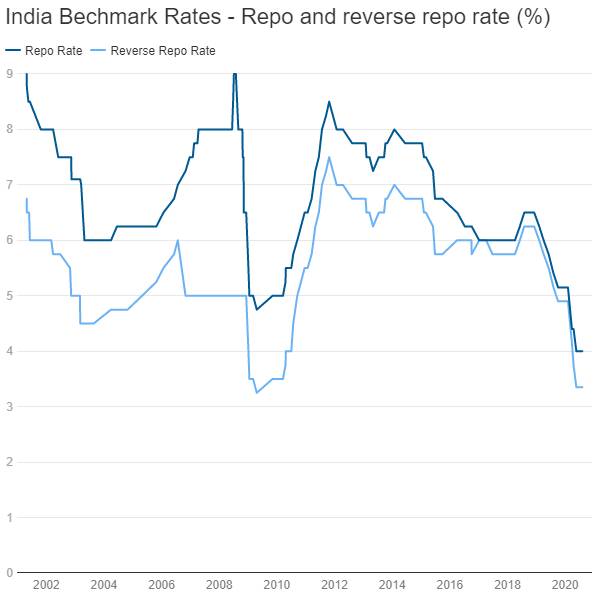
RBI responded the global financial crisis with a short period of sharp rate cuts in the 2008-09 period. Repo rate was lowered from 9% to 4.75% as India and the rest of the world adopted twin measure of monetary and fiscal stimulus to stave off recession and deflation. 10-year G-sec rallied from 9.35% levels to 5.3% levels. INR was highly volatile, GDP growth rose on stimulus but as it was driven by fiscal stimulus CPI inflation rose from 6.2% levels tto 10% levels. Fiscal deficit as % of GDP peaked at 6.46% levels. Bank credit and deposit growth was at higher levels. During that period Sensex was very volatile.
GDP growth started to fall, inflation started to rise on the back of the sudden jump in fiscal deficit. RBI had to resort to rate hikes again to lower inflation expectations.
RBI Rate Cut 2011-13
Third rate cut cycle was from 2011 to 2013. 10-year G-sec yield fell from 8.8% levels to 7.5% levels. USD/INR was volatile volatile, GDP was on downward path, CPI had fallen from 12.2% levels toward 10.2% levels. Fiscal deficit as % of GDP averaged around 5% levels. Bank credit and deposit growth fell. During that period Sensex was range bound.
The short rate cut period was not sustained as India’s macro’s were weak and the Fed started to talk of withdrawal of stimulus. INR depreciated to record lows, RBI tightened policy considerably and growth fell.
RBI Rate Cut 2015 – 2017
We are currently into the 3rd year of the 4th rate cut cycle since 2000. Repo rate has been cut by 200bps in this period in the face of weak economic growth and falling CPI inflation. 10-year G-sec yield has rallied from 8.8% levels to 6.5% levels. INR has strengthened. GDP growth is muted and CPI inflation has fallen from 9.2% levels to 2.5% levels. Fiscal deficit as % of GDP is down to 3.5% from 5% levels. Bank credit and deposit growth has fallen sharply. Sensex has rallied by 25% in this period.
The current rate cut cycle could extend to one more year after which the lagged effects of low interest rates will reflect on both growth and inflation.