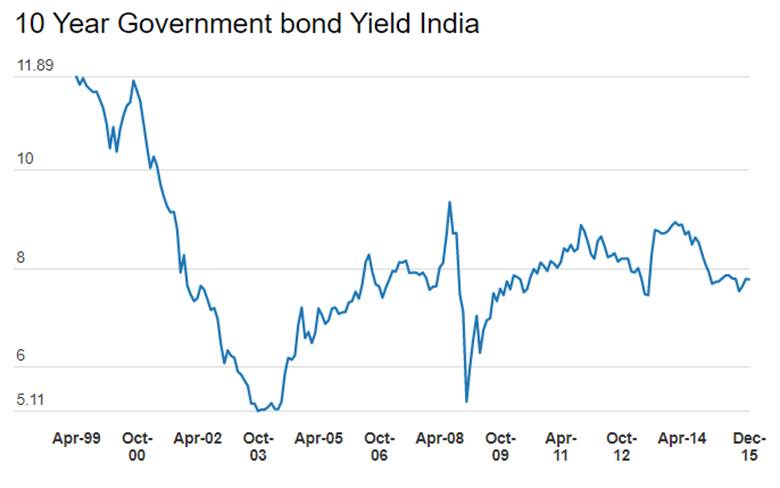
The sharp rise in public debt since 2008-09 has increased focus on debt management strategy of the government as market borrowings in the form of dated government securities and treasury bills constitute around 85% of public debt. The government finances its fiscal deficit largely through issue of dated government securities (ranging from 82% to over 90% of fiscal deficit) and rise in yields on government bonds increases cost of borrowing for the government, leading to higher interest outgo that in turn places more stress on government finances.
To support the growth momentum against the backdrop of the global financial crisis Central Government public debt increased by 157 per cent between 2008- 09 and 2015-16 (BE) to Rs 56575 billion. Central Government’s public debt consists of internal and external debt. The public debt is majorly internal and largely consists of fixed tenor and fixed rate market borrowings.
Internal debt of the Government of India is Rs.52,782.17 billion, 37.4% of GDP for 2015-16 (BE). Dated securities Rs. 44,177.87 billion, 31.3 per cent of GDP, accounted for 78.09% of public debt while treasury bills Rs. 4203.65 billion, 3% of GDP, accounted for 7.43%. The other items in internal debt are 14-Day Intermediate treasury bills Rs. 868.16 billion, securities against small savings Rs. 2,848.48 billion, securities issued to international financial institutions Rs 383.47 billion, compensation and other bonds Rs. 91.60 billion and special securities issued against Post Office Life Insurance Fund Rs. 208.94 billion, which together constituted 7.8% of public debt. External debt of Rs.3793.31 billion, 2.7% of GDP, constituted 6.70%of the public debt of the Central Government. External debt is from multilateral agencies such as IDA (International Development Association), IBRD (International Bank for Reconstruction and Development), ADB (Asian Development Bank) and small proportion of external debt originates from official bilateral agencies. Government of India has no borrowing from international private capital markets.
The weighted average coupon of outstanding debt of Central Government has increased by 28 bps to 8.09% in 2014-15 from 7.81% in 2011-12 with the increased borrowings over the years. But the ratio of interest payments to revenue receipts has shown decline to 36.9% in 2013-14 against 53.4%in 2001-02.
The sovereign debt portfolio is exposed to different risks such as rollover risk, interest rate risks, concentration risks and currency rate risks, which needs to be identified, analyzed and managed.
Rolling over debt at relatively higher cost or failure to rollover debt completely or partially and rising short term debt to the total debt ratio are potential risks to public debt management. The rollover risk is reflected in the redemption profile, residual maturity and average time to maturity of outstanding government securities. International comparison shows that India is among the countries having high average time to maturity of 10.23 years of government securities as on March 2015.
Government debt interest cost and repayment cost is impacted by movements in interest rates and exchange rates. Countries with large foreign currency denominated liabilities are exposed to exchange rate risks, which can impact macro economic stability.
Banks hold the largest portion of outstanding Government dated securities.Though SLR will be 20.5% by March 2017 from current levels of 21.5% (down from 25% over the last seven years), Central Government expects that there would be reasonable demand for its debt by banks in the medium term as credit offtake remains low at around 10% to 11% levels (down from over 20% levels seen five years ago). The cash flows of insurance companies, mutual funds and pension funds have improved in the recent past reflecting upturn in economic activity. Government expects insurance companies would have a reasonable demand for government securities in the medium-term
Government has adopted a Medium Term Debt Management Strategy Plan, which it intends to implement over the medium-term (three to five years) in order to achieve a composition of the government debt portfolio that captures the government‟s preferences with regard to the cost-risk trade off. In order to minimize rollover risk with an objective to smoothen the redemption procee, switching of short tenor bonds maturing near term with long tenor bonds is to be undertaken.Read our note on Government Bond Switches.
In order to limit currency risk, issuance of external debt will be kept low and participation of foreign investors in the domestic bond markets will be monitored through debt limits.
To ensure low debt structural risk central government has adopted following benchmark under medium term debt strategy.
The share of short-term debt is set at benchmark of 10+/-3% of total debt.
Weighted Average Maturity of Debt is 10+/-2 years.
In order to keep debt rollover manageable, every year the upper issuance limit for annual maturity bucket and also for individual security in a particular annual maturity bucket will be capped.
Indexed and floating rate debt issuance during a fiscal year is set at 5+/-2% of total issuance.
The share of external debt to total debt would be kept around 8+/-3% .
Gross Fiscal Deficit
In the medium term debt strategy plan, the government conducted two scenarios to project gross fiscal deficit till 2017-18.
Scenario one is optimistic economic condition where nominal GDP growth is assumed in a range of 13.5%-14.5%. It is expected that Debt/GDP ratio would improve from 32.9% in 2014-15 to 29.7%t in 2017-18, Interest payments/GDP ratio also improves from 2.7% in 2014-15 to 2.1 % in 2017-18 and gross fiscal deficit will be at 3% of GDP in 2017-18.
Scenario two is adverse economic condtion where nominal GDP growth is assumed in range of 10%-11%. It is expected that Debt/GDP ratio would deteriorate from 32.9% in 2014-15 to 33.7%t in 2017-18. Interest payments/GDP ratio also deteriorates from 2.7% in 2014-15 to 3.1 % in 2017-18 and gross fiscal deficit will be at 4.8% of GDP in 2017-18.

