
Bond markets have fuelled an asset price bubble and high inflation
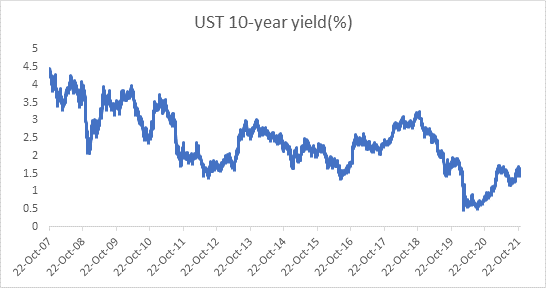
The financial crisis in 2008 brought about a cheap money policy that could never be reversed completely and the covid in 2020 has furthered the cause of cheap money. 10 year UST yields have not gone anywhere near levels seen prior to 2008 and this has caused an unsustainable boon in asset prices.
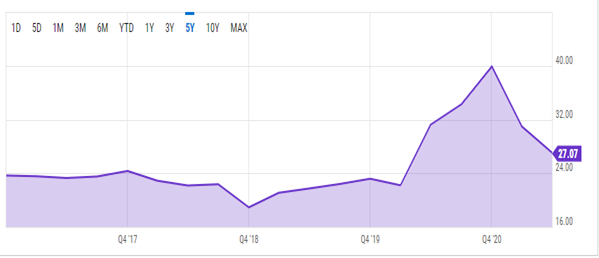
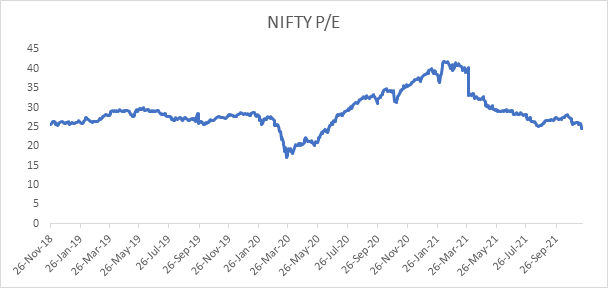
Equity valuations have gone berserk as seen by the listing of Paytm in India. Paytm stock price crashed on listing and this is sending out warnings of the beginning of a bubble burst.
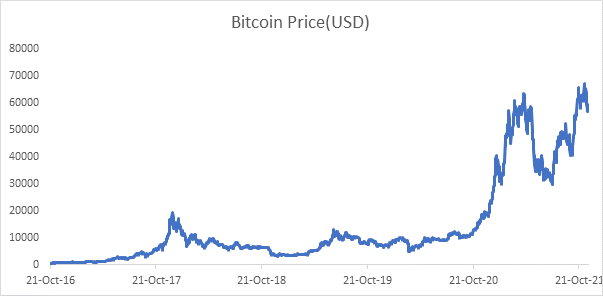
The boom in the cyrpto market that has seen millions of investors across the globe investing in crytos and taking the market capitalization to USD trillions is an effect of the cheap money floating in markets. This can also collapse if investors see sustained losses when there is no follow through buying.
Where do bonds stand?
Bonds are in highly uncertain territory with negative yields bonds outstanding at over USD 16 trillion. Inflation is visible all over the world and US is leading the inflation bandwagon with CPI at 3 decade highs. Equity valuations are astronomical even as cryptos are on a one way street up. Bonds are clearly in danger of being dumped by investors as inflation reduces the value of the bond through high negative real returns.
Where do G-secs stand?
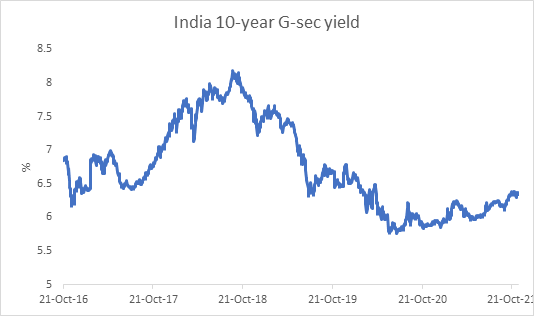
Gsec yields have risen from lows with the 10 year gsec yield up by 50bps from lows. However the markets are not seeing too much of stress at higher levels and 10 year gsec looks steady at 6.35% levels. Bond auctions are going through smoothly and this is a good sign for the market.
However, the threat of financial market instability caused by bubbles in equity, crypto and global bonds is a cause for concern as in rising inflation expectations. The sooner RBI recognizies this the better for bond markets and investors.
S&P 500 PE chart
Government bonds, SDL and OIS yield movements
During last week, 6.10% 2031 yield declined by 2 bps to 6.35% while 5.85% 2030 yield decreased by 5 bps to 6.38%. 5-year benchmark bond, 5.63% 2026 yield lost 5 bps to 5.67%. 6.64% 2035 yield declined by 5 bps to 6.76%. 6.57% 2033 yield came down by 8 bps to 6.69%. Long-term paper, 7.16% 2050 yield came down by 3 bps to 6.99%.
The spread of 10-year bond over 5-year bond rose to 68 bps from 65 bps in previous week. The 15-year benchmark over 10-year benchmark spread decreased to 38 bps from 41 bps, while 30-year benchmark over 10-year benchmark spread declined to 50 bps to 62 bps on weekly basis.
Average 10-year SDL auction cut-off came down to 6.9% from 6.93% in previous week while spread rose to 54 bps from 64 bps in previous week.
On weekly basis, 1-year OIS yield rose by 4 bps to 4.32% while 5-year OIS yield decreased by 4 bps to 5.47%.
We would love to hear back from you. Please Click here to share your valuable feedback