
Bond markets are facing a tough time with no real place on the yield curve to generate returns as short end yields rise sharply on rate hikes and draining of liquidity. Liquidity is being impacted by high fx sales by the RBI, amounting to close to USD 30 billion, draining out liquidity of over Rs 2 trillion.
There is no respite for long bonds given the heavy supply of gsecs and SDLs. Bond markets will be in a trading zone with a steady rise in yields and flat yield curve.
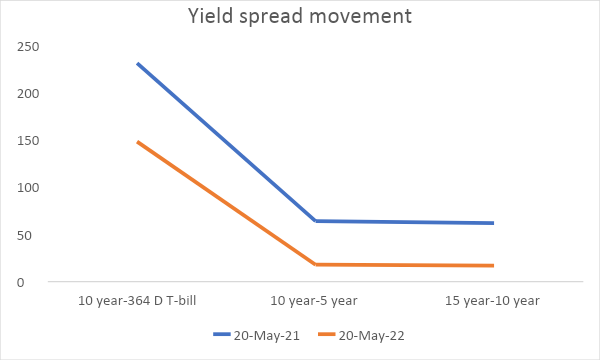
In the last 1 year, spread of 10-year benchmark over 364 days T-bill came down to 148 bps from 231 bps. Spread of 10-year benchmark over 5-year benchmark came down to 18 bps from 64 bps. Spread of 15-year benchmark over 10-year benchmark came down to 17 bps from 62 bps.
Government bonds, SDL and OIS yield movements
Last week, 10-year benchmark 6.54% 2032 paper yield rose by 4 bps to 7.36%. The 5-year benchmark bond, 6.79% 2027 yield rose by 3 bps to 7.18%. 6.64% 2035 yield increased by 1 bp to 7.51%. Long-term paper, 6.99% 2051 yield increased by 6 bps to 7.63%.
The spread of 10-year bond over 5-year bond rose to 18 bps from 17 bps in the previous week. The 15-year benchmark over 10-year benchmark spread increased to 17 bps from 15 bps while the 30-year benchmark over 10-year benchmark spread increased to 27 bps from 25 bps on a weekly basis.
10-year SDL auction cut-off came down to 7.70% from 7.76% in previous week while spread declined to 33 bps from 46 bps.
On a weekly basis, 1-year OIS yield rose by 2 bps to 6.22% while the 5-year OIS yield remained unchanged at 7.02%.
We would love to hear back from you. Please Click here to share your valuable feedback