
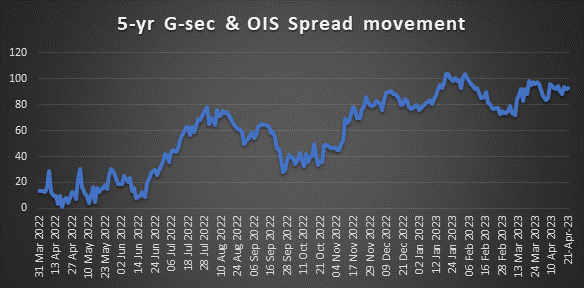
Since last one year, g-sec yield has seen an uptrend driven by policy rate hike, inflation and deficit system liquidity. In comparison with 5-yr g-sec yield movement, 5-yr OIS yield has increased at a slower place which can be seen from the above chart. Widening of spread can be attributed to deficit system liquidity caused by tightening monetary policy by RBI and inverted yield curve. Spread has declined from the peak during Jan-March 23 due to fall in consumer inflation which is evident from the chart.
In the last RBI MPC meeting, RBI has paused rate hike while consumer inflation fell significantly to 5.66% in March on monthly basis. In addition to it, system liquidity has amounted to a surplus level. Therefore, spread will see a fall which will lead to significant fall in short term yields as compared to longer term yields.
Government bonds, SDL and OIS yield movements
On a weekly basis, the new 10-year benchmark 7.26% 2033 yield came down by 5 bps to 7.16% while 7.26% 2032 yield lost 4 bps to 7.29%. 7.06% 2028 yield declined by 4 bps to 7.02%. 7.38% 2027 yield decreased by 5 bps to 7%. 5.63% 2026 yield decreased by 6 bps to 6.93%. Long-term paper, 7.40% 2062 yield came down by 3 bps to 7.34%.
The spread of 10-year bond over 5-year bond decreased to 14 bps from 17 bps as compared to the previous week. The 15-year benchmark over 10-year benchmark spread rose to 12 bps from 11 bps while the 30-year benchmark over 10-year benchmark spread rose to 17 bps from 14 bps on a weekly basis.
10-yr SDL auction cut-off yield declined to 7.56% from 7.59% in previous week while spread decreased to 34 bps from 37 bps as compared to previous week.�
On a weekly basis, 1-year OIS yield stood flat at 6.60% while the 5-year OIS yield lost 1 bp to 6.11%.
We would love to hear back from you. Please Click here to share your valuable feedback,