
The Economic Survey is released one day prior to the budget. The survey is released by the Ministry of Finance and details the performance of the economy during the fiscal year under review and in the previous fiscal years. The survey also outlines the outlook for the coming fiscal.
The Economic Survey 2012-13 presents a challenging year (s) for the Indian economy. GDP growth has slowed, inflation at the consumer level is high, fiscal and current account deficits are rising and investments and savings are down. Budget 2013-14 needs to address all these issues if the Indian economy is to strengthen.
The economic survey is an exhaustive document running into many pages. We present a pictorial snapshot of the survey that will give you a perspective on the issues facing the economy.
Chart1. Sharp slowdown in GDP growth in 2012-13
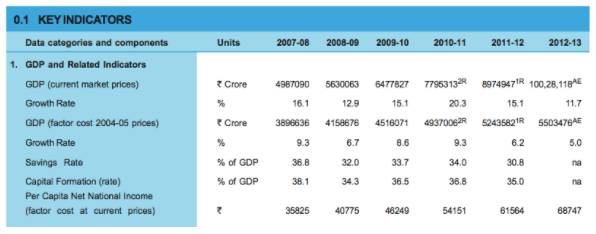
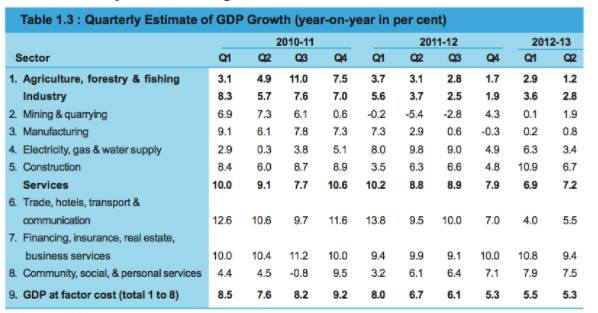
Chart2. Quarterly trends in GDP growth
The government has estimated that GDP will grow in a 6.1% to 7% range in 2013-14. Is it achievable? Services  contribution to GDP was at 65% while industry and agriculture contribution to GDP was at 27% and 8% respectively for the last ten years. Services will have to lead GDP growth higher given decline in growth in agriculture and industry.
Chart3. Savings and Investment Gap
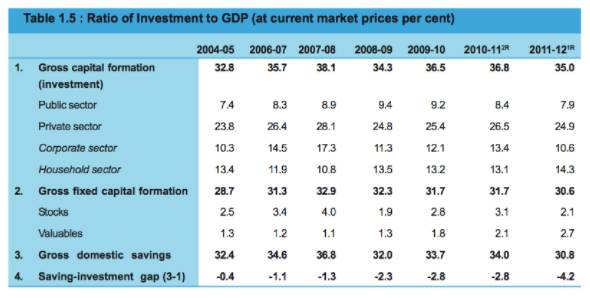
Chart4. Rising trade deficit is impacting current account balance
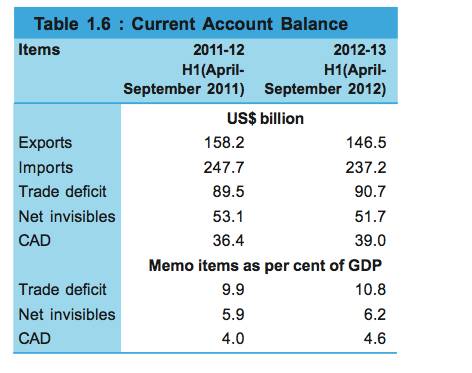
Chart5. Rising Gold imports is contributing to higher CAD
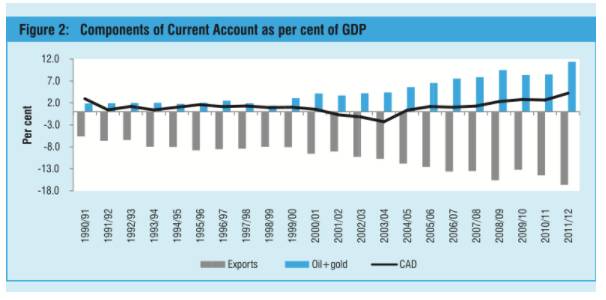
Gold imports have gone up by nine times since 2008. High inflation is attributed to increased demand for gold in the country.
Chart6. Inflation has hit financial savings of households.
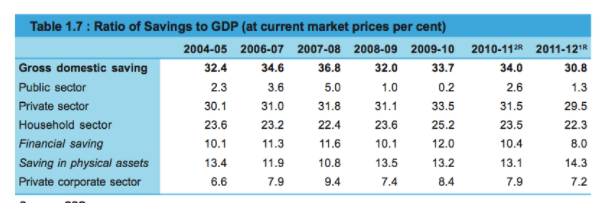
Shares and debentures as a percentage of household financial savings has seen a decline from 13% in the 1990’s to 4.8% in the 2000’s. This trend has to be corrected for the country to create productive capacity.
Chart7. Food inflation is preventing WPI(Wholesale Price Index) from coming off
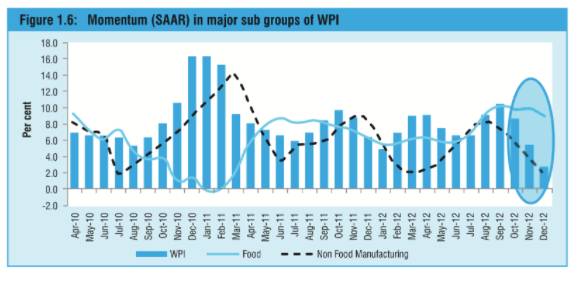
Chart8. Foreign capital flows are financing the CAD
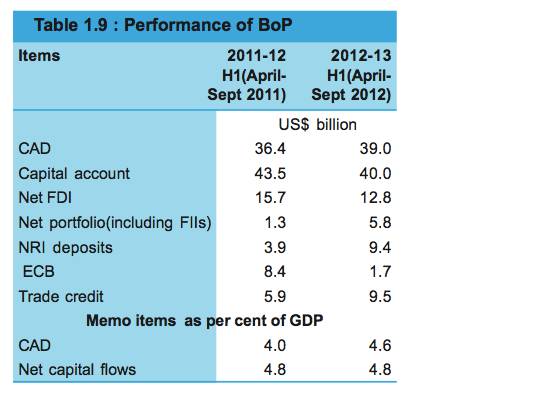
The government is keen on more capital flows to negate a rising CAD.
Chart9. Fiscal Deficit requires to be brought down
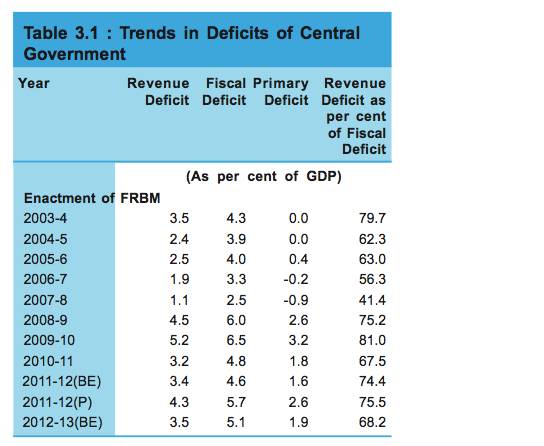
Government estimates a fiscal deficit of 5.3% of GDP for 2012-13
Chart10. High nominal GDP growth is financing the fiscal deficit
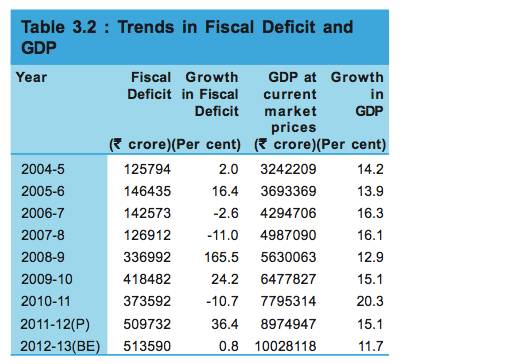
The government cannot inflate away the fiscal deficit as repercussions are seen elsewhere in the form of lower household savings, high current account deficit and high interest rates.