
The unprecedented 9 years of record low interest rates globally is coming to an end. The Fed has raised rates thrice by 25bps each in 2017 and is likely to raise rates by 75 bps in 2018 and 2019. ECB will most probably end QE in 2018 and guide for higher rates in 2019. Prospects of economic growth and inflation are looking brighter with US leading the way. US equity indices are at record highs while European indices too are trending at record highs. Commodity prices have rebounded from lows in 2016 and outlook for select industrial commodities is positive. Read our and and report on
US treasury yields are climbing and have backed up by 100bps from lows seen in 2016. Yields in Germany have risen from negative levels. The USD has weakened from highs while emerging currencies have gained traction. Read our and reports for detailed analysis.
India in the backdrop of rising interest rates globally, albeit from record lows, will be hard pressed to buck the trend though rates may not rise by much. RBI will keep the Repo Rate stable at 6%, keep liquidity easy and comfortable while the government spends to push up economic growth even as it tries to keeps down fiscal deficit.
India inflation is unlikely to go down to 4% levels but will stay within the RBI 4% +/- 2% target range. Stable oil prices, improved supply as stalled projects take off will keep down inflation expectations. However as economic growth improves and output gap narrows, inflation expectations will rise. RBI has changed its policy stance from accommodative to neutral and will most probably signal the end of low interest rates in the economy.
Steady repo rate, stable inflation, comfortable liquidity and manageable macros will keep yields steady while rising global bond yields will push the yield curve by around 25bps to 50bps from current levels. The yield curve will be steep and steady.
Corporate bonds too will see rise in yields though spreads will stay down on good liquidity and improved corporate health. Economic growth can lower spreads at the lower end of the credit rating scale.
Ideal fixed income portfolio in 2018 will be 50% in AAA rated corporate bonds of maturities of five years, 50% in lower rated corporate bonds of maturities of 3 years to 5 years. Less risk averse investors can increase weight in AAA bonds and lower weight in lower rated bonds.
In terms of fixed income funds, 50% in short term income funds and 50% in credit funds. Less risk averse investors can invest 25% in ultra short funds, 50% in short term income funds and 25% in credit funds.
Tax free bonds is avoidable as tax rates could come off in the budget and outlook for yields at the long end of the curve is not positive.
Risk to Fixed Income Investment Strategy 2018
The primary risk for interest rates is sharper than expected inflation in the US leading to faster pace of Fed rate hikes, which can lead to capital outflows. Credit spreads could be affected if economic growth is weak and that will lead to rise in yields on lower rated corporate bonds.
Risk of demand and supply mismatch in government bonds exist. Banks, the largest holders of government bonds are holding bonds well in excess of statutory requirement and if they do not participate in government bond auctions and sell governments bonds if credit offtake improves, yields could trend up faster than expected.
Introduction
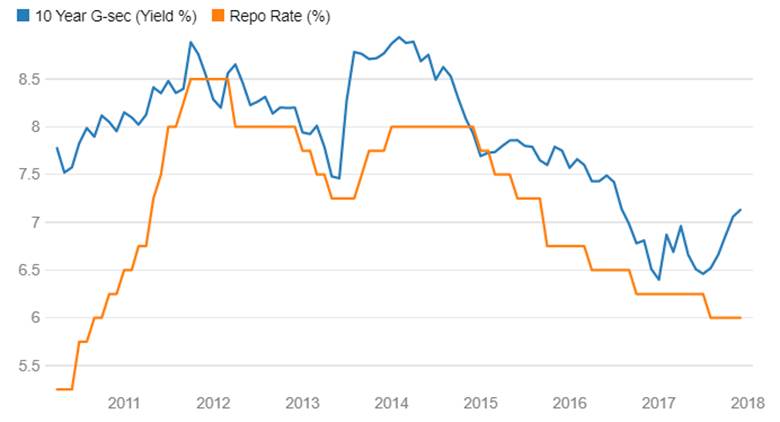
The ten year government bond to repo rate spread which had fallen sharply in early 2017, on the back of demonetisation and RBI rate cut expectations, has started to widen again after RBI hawkish stance on inflation in December 2017. The December policy minutes confirmed rate cut cycle had come to an end. The government bond and repo rate spread is likely to widen further and stay wide as markets factor in no rate cuts in 2018.
10 Years G-sec Vs repo rate (%)
What is the outlook for the bond market in 2018 and what should be the fixed income strategy for this year? We answer these two questions in this Fixed Income Investment Strategy Report for 2018.
What is the outlook and strategy for the bond market in 2018?
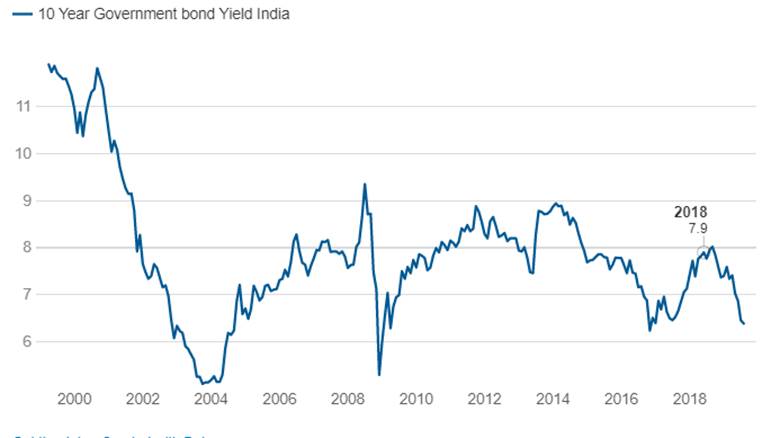
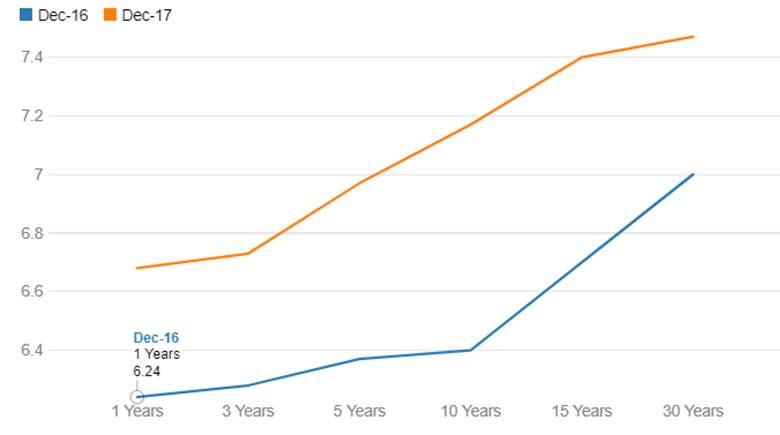
The year 2017 saw the government bond yield curve steepening Chart 2 & Chart 3 as bond yields moved up sharply on various factors such as RBI Policy, Inflation, Bond Oversupply, Concern on Fiscal Slippages and Fed Rate Hikes.
1. RBI CPI inflation target for 2018 – RBI has kept a CPI medium term inflation target at 4% but for 2018, it will maintain a target of 5%, which is the level it had kept for 2017. RBI will consider better prospects for US and global economic growth and higher domestic economic growth when it sets the target. Implicit real rate of interest is around 1.00% at repo rate of 6.00%, which is seen as positive for economic growth
2.Fed Rate Hikes – The Fed hiked rates from record lows of zero percent maintained since December 2008 for the first time in December 2015 and followed up with another 75 bps hike in 2017. The Fed has guided for further 3 more rate hikes in 2018. Fed rate hikes indicate strength of the US economy and if there is divergence between relative economic strength of India and US, capital outflows could be high. RBI will not want to risk outflows and would be hesitant to cut the repo rate unless there are positive factors that could bring in capital inflows into the economy.
10 Year Government bond Yield India (%)
India Yield Curve (G-sec)
Inflation, Fiscal Deficit,CAD and Global Macro
Inflation Expectations
RBI raised CPI inflation range from 4.2% to 4.6% to 4.3% to 4.7% in the second half of this fiscal year ,indicating risks to core inflation is on the higher side on the back of 7th pay commission impact on rents, higher fuel prices and rising input costs.
CPI inflation for November 2017 printed at 4.88% against 3.58% levels seen in October 2017 and 3.63% levels seen in November 2016. Chart 4 Food inflation was 4.42% November 2017 against 1.9% in October 2017. Core inflation held steady at around 4.75% to 5% levels over the year. RBI has forecast inflation at 4.3% to 4.7% levels as of March 2018. RBI’s medium-term CPI target is 4% but given that the government will spend for growth in its 2018-19 budget, Budget may also look at a fiscal push to rural growth leading to both higher borrowings and higher inflation on the back of consumption demand. and that global economies are expected to do better, which could take up select commodity prices, inflation target for 2018 would be around 5% levels.
India’s index of industrial production rose by 2.5% in the April-October 2017 period against 5.5% seen last year, Industrial production has struggled in 2017 due to double whammy from Demonetisation and implementation of GST. However going forward industrial production is expected to do well as industry has come out from the shock of demonetisation, improvement in consumer demand and government is working hard to end GST glitches Chart 5
India’s economy is expected to grow at levels of around 6.7% in this fiscal year with growth being brought down from initial forecast levels of around 6.9% on effects of demonetization and disruptions related to the implementation of GST. Chart 6 Economic growth would revive in 2018-19 on government spending and improved global economic growth. Exports have started to show a positive trend since September 2016 (except October 2017 data) which indicate improvement in global trade conditions.
Fiscal Deficit and Demand Supply of Government Bonds
The government has announced they will borrow an additional Rs 500 Billion in this fiscal year, this move comes after revenue collection from GST fell to its lowest level. Finance Ministry said there will not be any net additional borrowing as T-bills will be run down by Rs 612 Billion. Additional borrowing suggests that government will not cut its spending to meet its fiscal deficit target as that will weaken economic recovery. Fiscal concerns have risen on account of a decline in collections from the GST, lower dividend from the RBI and the spectrum auction unlikely to yield much this year. With additional borrowing of Rs 500 Billion in this fiscal, market expect there will be a populist budget in 2018-19 ahead of the 2019 General election and government may not adhere to FRBM target of fiscal deficit of 3% of GDP.
It is imperative that the government sticks to its commitment of fiscal deficit of 3% of GDP for fiscal 2018-19 if it wants interest rates to stay stable in the economy. The reason is that banks have upped their investments in government bonds post demonetisation. Investments have grown by 16% as of October 2017, year on year, against growth of 21% seen last year. Banks are already well above the SLR rate of 19.5% (as of January 2018) at levels of 28%. Demand from banks for government bonds will be low next fiscal year.
Current Account Deficit, INR
CAD is financed by capital flows that have been adequate so far. Capital flows are expected to be much higher than the CAD over the next two years leading to positive BOP (Balance of Payment) position that will lead to accretion of fx reserves and improved external fundamentals.
The INR is now an important factor in determining the level of interest rates in the economy given the amount of debt portfolio flows into the economy. INR can sustain its levels if the CAD is manageable and BOP position is positive and this would enable interest rates in the economy to trend down on improved liquidity position as the RBI purchases USD. Bond yields would trend down given improved liquidity situation.
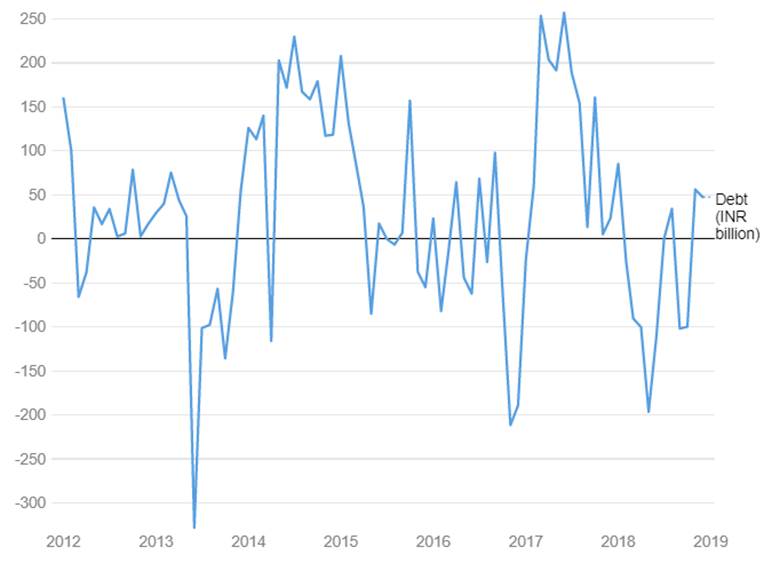
Portfolio flows were positive by USD 23.02 billion for debt in the CY-2017 period while equity saw inflows of USD 7.37 billion. Portfolio flows were highly positive during this calendar year as market sentiment has improved after reform( Demonetisaztion & GST). Debt could see muted flows on Fed rate hike expectations but as the global economy stabilizes and an outlook for emerging economies improve. Chart 8
In the first half of 2017-18, foreign exchange reserves rose by USD 20.9 billion on strong capital flows despite the rise in current account deficit. Current account deficit (CAD) at USD 7.2 billion (1.2% of GDP) in Q2 of 2017-18 increased sharply from USD 3.4 billion (0.6% of GDP) in Q2 of 2016 -17 but fell sharply from USD 15.0 billion (2.5% of GDP) in Q1 of 2017-18.The widening of the CAD on yearly basis was primarily on account of a higher trade deficit (USD 32.8 billion) attributed to a larger increase in merchandise imports relative to exports, specifically due to higher oil imports.
INR has been a relative outperformer against the USD with respect to other global currencies. Table 2. INR is likely to stay stable given positive BOP position and would continue to outperform its peers in 2018.
Balance of Payments rose in the 2nd quarter of fiscal 2016-17 driven by rise in FDI and FII flows. Positive foreign flows indicate confidence among overseas investors in the Indian economy.
The trade deficit was at USD 99.9 billion in the April-November period from levels of USD 67.9 billion last year as imports jumped 21.9% while exports rose at a slower pace of 12%. Exports were lower due to the implementation of GST as exporters had to first pay IGST and seek refunds after the goods were exported. Apart from that technology glitches while filing GST led to delayed in tax refunds.
FDI flows were USD 12.4 billion in the 2nd quarter of fiscal 2017-18 (against USD 17.2 billion last year and USD 7.2 billion in the 1st quarter of fiscal 2017-18) and FII flows were USD 2.1 billion (against USD 6.1 billion last year and USD 11.9 billion in the 1st quarter). On Balance of payment basis, in the 2nd quarter 2017-18, USD 9.5 billion was added to the foreign exchange reserves as compared with USD 8.5 billion in 2nd quarter of 2016-17 and USD 11.4 billion in the 1st quarter 2017-18.
Monthly FII Net Investments
Global Macro
The outlook for global interest rates and global liquidity is extremely important for levels of yields on the ten year government bond. Global markets move on currency plays that in turn depend on Central Bank Policies. Going into 2018, interest rates are looking to rise while liquidity will stay high globally. This is despite the US Fed raising interest rates. The ECB and Bank of Japan are providing stimulus to their respective economies leading to the Euro and Japanese Yen trending down against the USD. Global markets will look to borrow in Euro and Yen to fund carry trades. Funding rates are expected to stay down for Euro and Yen borrowings. Charts 9, 10 & 11
On the global economy front, China saw some weakness in manufacturing due to PBoC deleveraging campaign and Government intention to control pollution by shutting inefficient mills . The Chinese Yuan has appreiciated in 2017 as deleveaging campagin by PBoC has boost market sentiment.
US economy saw the steady pace of job growth with falling unemployment rate and rising consumer confidence. Eurozone saw falling unemployment rate and rising inflation which is good news for the ECB even as it maintains the ultra loose policy. Japan too is facing a lack of inflation prompting the Bank of Japan to maintain its stance of keeping 10 year JGB yields around 0%. Economic data has shown improvement in Japan but is not translating to higher prices.
Global bond yields have climbed in 2017. Table 3 Going into 2018, bond yields are likely to rise as growth optimism takes over markets. However bond yields will still stay far below peaks seen in 2007 as inflation is expected to stabilise at moderately higher levels given that the global economic growth is not expected to run away.
Credit spreads have fallen sharply across the rating scale on the back of huge liquidity due to demonetisation and RBI fx purchase. Credit markets still witnessed stress as banks NPA issues continued into this fiscal year. Chart 13, Table 4.
Credit spreads at the higher end of the rating scale were relatively calm as markets invested excess liquidity into corporate bonds offering high safety. Chart 12
Going into 2018, credit spreads are likely to stay stable for higher rated credits while spreads could fall for lower rated credits as the economy improves.
Global credit markets showed high volatility with junk bond yields falling to 5.43% level in October 2017 from 6.00% levels seen in January 2017, Since October 2017 US Junk bond yields have been rising and currently trades at 5.84% levels Chart 14
